SLIDE 1
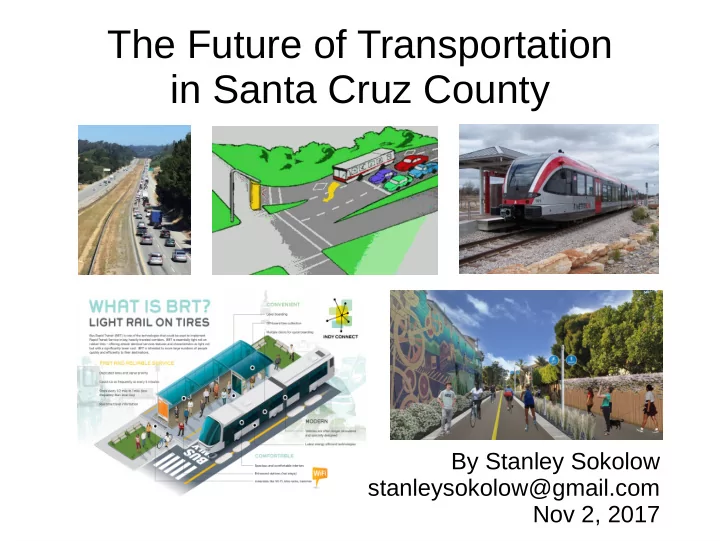
The Future of Transportation in Santa Cruz County
By Stanley Sokolow stanleysokolow@gmail.com Nov 2, 2017
SLIDE 2
The Campaign for Sensible Transportation
Sensibletransportation.org www.facebook.com/sensibletransportation/
SLIDE 3
Measure D Transportation Tax – It passed. What's next? –
SLIDE 4
Measure-D-Funded Projects have been approved, but we need more.
SLIDE 5
Unified Corridors Investment Study (UCIS)
SLIDE 6
Goals of the UCIS
SLIDE 7 Phase I: Created computer models for transportation planning in SC County. Phase II: Consultants will use the models to forecast impacts of projects in the chosen scenarios by year 2035 time horizon. Scenarios approved June 15, 2017
SLIDE 8
Highway 1 at 8:37 am
SLIDE 9
SLIDE 10 I-405 Sepulveda Pass Widening
< Before > < During After > Duration of construction: 5 years; cost = $1.1 Billion; added HOV lanes, more ramps.
Study immediately after construction found
congestion slightly worse than before.
SLIDE 11 Why WIDENING WON'T WORK: Induced & Generated Traffic
- When road capacity increases, peak-period
trips also increase until congestion again limits further traffic growth.
- Short term: people change their routes and take
trips they previously avoided (latent & generated traffic).
- Long term: people move to more distant
locations because travel became easier (induced travel).
SLIDE 12
Increased road capacity: it fills up and benefit declines. Transit on separate R.O.W.: benefit slowly climbs.
SLIDE 13 Highway 1 projects in the Unified Corridors Study
- bus lane on Hwy 1 (median) shoulder
- add more auxiliary lanes beyond those in Measure D
- HOV lanes (2 or more persons)
- increase transit frequency
- metering signals on Hwy 1 on-ramps
- add lanes on Hwy 1 bridge over San Lorenzo River
- Mission Street intersection improvements
- rail transit on Hwy 1 between SC and Watsonville
- self-driving cars (study their impacts)
SLIDE 14 Soquel Ave/Dr & Freedom Blvd
- Bus Rapid Transit (BRT) “lite”
– Faster boarding – Transit signal priority – Queue jumps
- Dedicated lane for buses and bicycles
- Remove parking to make way for bus & bikes
- Buffered or protected bike lanes
- Express buses, more frequency
- Intersection improvements
– For autos – For bicycles & pedestrians
SLIDE 15 Rail Corridor
- Multi-use trail shared by bicycles & pedestrians
– This is already committed for a 12' to 16' wide trail.
- Separate trails for bicycles & pedestrians
– Being pushed by SCC Greenway group.
- Passenger train service (local & inter-regional)
- Bus Rapid Transit (BRT)
- Freight service on railroad
– Currently freight is only on the 4 track-miles northward from Pajaro. – While Cemex cement plant was operating before it closed in 2010,
- nly 2% of county's freight went by rail. Cemex had been the
biggest shipper.
– Iowa Pacific contract expires in 2022.
SLIDE 16 Overall Projects
- Bicycle & pedestrian facility improvements
- Additional transit connections (routes? stops?)
- Bike share (rent-a-bike by the hour)
– City of Santa Cruz is going to do it.
- Bike amenities (secure parking?)
- Transit amenities (wifi? Sheltered stops?)
- Park-and-ride lots
- Multi-modal transportation hubs
- Transit incentive programs (employer, residences)
- Public education & enforcement (electric vehicles, motorist
safety, bicycle safety)
SLIDE 17 Projects not being considered which some people have suggested
- Personal Rapid Transit (PRT = pods on elevated track)
- Toll lanes with congestion-based pricing
- Increased parking fees
- A lane on coastal trail for electric bikes & velomobiles
- Train to UCSC campus
- Train through tunnels to San Jose
- Parking meters on every street
- Build affordable housing closer to jobs
SLIDE 18
The Great Santa Cruz Trail: SCC Greenway wants only a trail
But, is it equitable to Watsonville commuters?
SLIDE 19
Coastal Rail Santa Cruz group wants this.
Train crossing signals & booms are not shown, but would be required.
SLIDE 20
Some want Bus Rapid Transit like this busway in Cambridge UK
SLIDE 21
The Great Santa Cruz Trail study forecasts extremely low Watsonville-to- Santa Cruz bicycle commute usage.
SLIDE 22
Even in Denmark, 87% of bicycle trips are less than 3 miles.
Less than 1% of trips are more than 12.4 miles. Bicycle commuting won't solve freeway congestion.
SLIDE 23 HOV or bus lanes on freeway
– Only southernmost few miles of freeway have enough
width in the median.
– A switchable lane is not feasible. – Toll lanes are not worth the cost in our situation. – Widening requires rebuilding 2 railroad bridges and 4
- verpasses to accommodate wider freeway plus
widening the freeway bridge over Aptos Creek.
– Must purchase more land in a few places. – Estimated cost $640 million in 2015 dollars. – https://sccrtc.org/projects/streets-highways/hwy1corridor/
SLIDE 24 Passenger train study findings
- Existing railroad infrastructure is not adequate for
passenger service, needs upgrades.
- Between Santa Cruz & Watsonville: $133,200,000
- Annual operating & maintenance = $9,882,000
($727/revenue-hour)
- SC Metro bus system O&M = <$200/revenue-hour.
- 5 DMU trains @ $8,500,000 each
- Train replacement annualized = $42,500,000 / 30
years = $1.4 million/year.
SLIDE 25
How full would any train be at the most?
Peak passenger load = 64 riders
SLIDE 26
Typical light-rail train
Stadler Diesel: Capacity 200 to 220 riders.
SLIDE 27
BYD Articulated Battery-Bus
Capacity = 120 passengers, seated & standing
SLIDE 28 Electric Bus Capital Cost
- Initial purchase of 5 DMU @ $8.5 million
each = $42,500,000.
- Initial purchase of 10 BYD articulated buses
@ $1.4 million each = $14,000,000.
- Annualized replacement cost of buses is
less than replacement of trains.
- Paving 1 lane 19 miles @ $2 million/mile =
$38 million.
SLIDE 29 Coastal Bus versus Train
corridor.
– Direct service possible. – Can detour around
- bstructions.
- Lower cost, but service life
is 14 years.
- Quieter, lighter weight so
less vibration, no mandatory horn blasts, ordinary signal lights at crossings; no bells.
- Self-driving buses are being
tested in several cities.
- Train is stuck on the corridor
rails.
– Trunk and feeder only. – Can't detour. Obstructions
stop trains.
longer (30-years).
- Horns at crossings (possible
quiet zones), wheel screech
- n curves, vibrations, bells
at crossings.
- Self-driving trains exist
already.
SLIDE 30
Autonomous mini-buses will reduce operating cost, increase span, and make direct service (taxi bus) feasible.
SLIDE 31 Chinese autonomous bus in testing.
Drove itself 20 miles through the busy city of Zhengzhou in 2015, including lane changes, passing, and responding to traffic lights. Notice that the driver has his arms up to show he's not steering. Speed was up to 42 mph.
http://www.citylab.com/tech/2015/10/china-rolls-out-the-worlds-first-driverless-bus/408826/
SLIDE 32
There was a time when every elevator had an operator.
Will the bus driver go the way of the elevator operator? How soon?
SLIDE 33 Autonomous Shuttles May Soon Upend Public Transportation
Car and Driver, OCTOBER 3, 2016
- Researchers modeled 8- and 16-passenger
autonomous buses in Lisbon, Portugal.
- 50 percent reduction in prices for trips.
- Congestion disappeared.
- Emissions fell by a third, even though the
modeled buses were not electric.
- Space needed for public parking fell by 95
percent.
- http://blog.caranddriver.com/bye-bye-buses-autonomous-shuttles-may-soon-upend-public-transportation/
SLIDE 34
Bus Queue Jumping
SLIDE 35
Transit Signal Priority gives buses a green light
SLIDE 36
Can Smart Phone Help Us & RTC Figure It Out?
Join Our Study Group: http://SensibleTransportation.org/contact/
SLIDE 37
Parking Demand Management Instead of More Parking Garages
SLIDE 38 The End
Find us on Facebook too: https://www.facebook.com/sensibletransportation/