
SLIDE 1
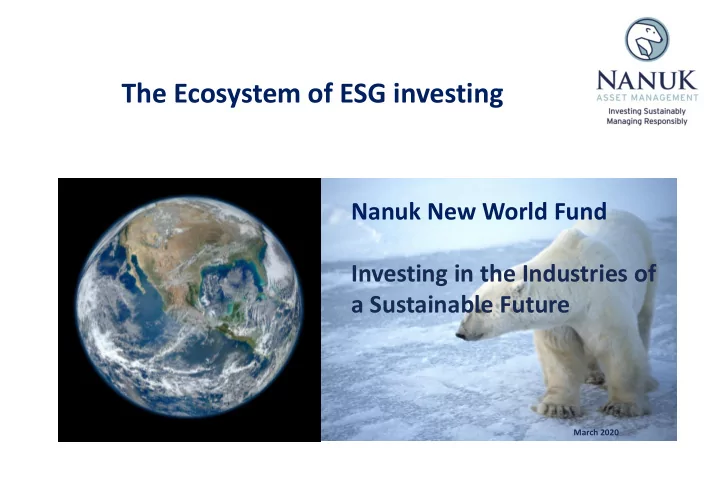
The Ecosystem of ESG investing
Nanuk New World Fund Investing in the Industries of a Sustainable Future
March 2020
The Ecosystem of ESG investing Nanuk New World Fund Investing in - - PowerPoint PPT Presentation
The Ecosystem of ESG investing Nanuk New World Fund Investing in the Industries of a Sustainable Future March 2020 Firm Objectives Early Validation 600 MSCI All Country World Total Return Index (AUD) 500 FTSE Environmental Opportunities
March 2020
2
Sources: Nanuk, Bloomberg, FTSE Russell, $A, annualised returns. The New World “Strategy” performance constitutes the following: (1) Nanuk New World Fund net return since launch on 2 Nov 2015 , (2) New World Fund Model return since 3 March 2015 net of estimated fees and expenses of 2.5% p.a. and (3) performance series based on the long book of the Nanuk Global Alpha Fund less an annualized expense ratio of 2.9% from 31 Jul 2012 to 13 March 2015 . Past performance is not an indicator of future performance.
100 200 300 400 500 600 Sep-1999 Sep-2000 Sep-2001 Sep-2002 Sep-2003 Sep-2004 Sep-2005 Sep-2006 Sep-2007 Sep-2008 Sep-2009 Sep-2010 Sep-2011 Sep-2012 Sep-2013 Sep-2014 Sep-2015 Sep-2016 Sep-2017 Sep-2018 Sep-2019 MSCI All Country World Total Return Index (AUD) FTSE Environmental Opportunities All-Share Total Return Index (AUD) NANUK New World Strategy (AUD)
3
Investment aligned with values Reduced exposure to ESG risks Improving corporate behavior Favour investments related to improving E&S sustainability Measurable positive E & S
Typically negative screening Typically favours companies with high ESG Ratings Involves direct engagement with companies Increasing focused on UN Sustainable Development Goals Unlisted investment (in some cases philanthropic in nature)
4
Mastercard JPMorgan Microsoft Prysmian Waste Connections Tesla
Specialty Finance US Bank Software Electrical & Fibre Optic Cables Waste Managm’t Electric Vehicles
Traditional Sustainalytics ESG Assessment
86 82 98 51 38 25
Sustainable Platform SDG based Sustainability Assessment
21% 37% 44% 94% 90% 93%
Total SDG Contribution ESG Rating (/100)
Source: Sustainalytics & Sustainable Platform January 2020
5
6
7
8
Source: Our World In Data
9
10
11
Source: choices.climatecentral .org Feb 2020
12
Source: choices.climatecentral .org Feb 2020
13
Source: choices.climatecentral .org Feb 2020
14
15
16 Sustainable Technologies Growth, Complexity, Inefficiency, Disruption
Environmental & Resource Constraints Economic Development Population Growth & Demographics Government Policy New Technologies Advanced Manufacturing Falling Technology Costs
Multiple influences are driving the transition to more sustainable technologies, products and services
17
Electric Vehicles Energy Storage Autonomous Driving Advanced Manufacturing Collaborative Robots Renewable Energy Industrial Internet of Things Advanced Materials
18
Solar modules Wind Energy Lithium Batteries Power Inverters LED Lighting Sensors Data Network Equipment GPS Location Chips Industrial Lasers
19
20
Long term targets Policy Support Initial growth phase Industry develop- ment The Point of No Return LT growth
21
Electricity and Heat Production 25% Agriculture, Forestry, Land Use 24% Buildings 6% Transport 14% Industry 21% Other Energy 10%
Source: UN IPCC, 2014
22
23
Source: Bloomberg New Energy Finance
24
25
Road - Cars 40% Road - Trucks 34% Ships 11% Planes 11% Trains 5%
26
https://eciu.net/netzerotracker
27
28
Source: Bloomberg New Energy Finance
29
30
Land clearing, Land use change, forestry 46% Ruminent enteric fermentation 19% Ruminent waste 7% Fertilisers 11% Energy Use (fuel) 9% Rice Production 5% Manure management 4%
31
32
Source: WRI analysis based on FAO 2011
33 Agricultural 70% Industrial 22% Household 6% Drinking 2%
5000 10000 15000 20000 Beef Nuts Mutton Pork Chicken Eggs Cereal Milk Fruits Vegetable
34
35
36
37
Packaging 47% Other Sector 14% Textiles 13% Consumer and Institutional Products 12% Transportation 6% Building and Construction 4% Electrical / Electronic 4% Industrial Machinery 0%
Source: Geyer et al. (2017) Source: www.resourcelab.dk
38
39
40
Examples of Nanuk New World Fund stock holdings as at 30 January 2020
41
Source: FactSet
Financial Metrics (Consensus) Market Cap (USDb) 1.9 Net Debt (USDb) 2.7 ROE (NTM) 5% PB (NTM) 1.6 Dividend Yield 0.0%
42
Financial Metrics (Consensus) Market Cap (USDb) 5.1 Net Debt (USDb) 1.4 ROE (NTM) 12% PE (NTM) 19.3 EV/EBIT (NTM) 15.9 Dividend Yield 2.8%
43
Source: FactSet
Financial Metrics (Consensus) Market Cap (USDb) 61.3 Net Cash (USDb) 4.0 ROE (NTM) 19% PE (NTM) 41.7 EV/EBIT (NTM) 31.8 Dividend Yield 0.0%
44
Source: FactSet
Financial Metrics (Consensus) Market Cap (USDb) 23.9 Net Cash (USDb) 0.1 ROE (NTM) 25% PE (NTM) 34.8 EV/EBIT (NTM) 25.1 Dividend Yield 0.0%
45
Source: FactSet
Financial Metrics (Consensus) Market Cap (USDb) 52.5 Net Debt (USDb) 10.5 ROE (NTM) 25% PE (NTM) 26.0 EV/EBIT (NTM) 20.4 Dividend Yield 1.8%
46
Exceptions to the exclusion criteria may be made in circumstances where a relevant business is discontinued or marked for sale. As at 30 Jun 2019.
Sector Exclusion Criteria Identified Exclusions Climate Change, Fossil Fuels & Environment Revenue and Norms Based 917
Coal & Coal-Based Energy Mining, Exploration & Extraction >0% 239 Coal Fired Generation >10% Services & Equipment Supply >30% Oil & Gas Exploration, Extraction, Production & Refining >0% 628 Services & Equipment Supply >30% Oil-fired Generation >5% Gas Generation >30% and Gas > Renewable Generation Uranium Mining and Refining >0% 13 Nuclear Generation Nuclear Generation >10% and Nuclear > Renewable Generation 13 Severe Environmental Damage Norms-Based Criteria, case by case 24
Weapons Revenue Based 169
Cluster Munitions & Anti-personnel Landmines Production & Manufacturing >0% 8 Nuclear Weapons Production & Manufacturing >0% 16 Military Contracting & Equipment Services & Equipment Supply >10% 123 Weapons & Small Arms Production & Manufacturing >0% 22
Ethical Values and Human Rights Revenue and Norms Based 714
Adult Entertainment Production, Manufacturing, Sales & Distribution >0% 5 Alcohol Production & Manufacturing >0% 271 Correctional Facilities Ownership, Management, Operation & Service Provision >0% 2 Gambling Ownership, Management & Operation >0% 211 Gross Corruption Norms-Based Criteria, case by case 3 Tobacco Production & Manufacturing >0% 179 Serious Violation of Human Rights & Ethical Norms Norms-Based Criteria, High-Risk Countries / Areas, case by case 43
1,800
Sector Weight Examples
Renewable Energy / Infrastructure 12.4% Industrial Efficiency / Robotics and Automation 11.5% IoT / Big Data / AI 11.4% Waste Management & Recycling 10.2% Building Energy Efficiency / Sustainable Buildings 8.7% Rail Transport 7.6% Healthcare Equipment 5.9% Information Services 5.9% Water Treatment / Infrastructure 5.5% Food / Nutrition / Aquaculture 5.1% Sustainable Materials / Packaging 4.9%
47
48
Sources: Factset, SQM, Nanuk, Fund Performance: Notes (1) Inception date November 2, 2015 (2) Benchmark = FTSE EOAS TR $A (3) MSCI ACWI TR $A. Past performance is not an indicator
Nanuk New World Fund (AUD, %) 1 mth YTD 1 yr 2 yr (pa) 3 yr (pa) Since Fund Inception 1 (pa) New World Fund Return (%) 5.2 5.2 31.5 14.1 18.4 15.3 FTSE EOAS Benchmark Return 2 (%) 4.4 4.4 32.8 14.3 17.8 14.2 Value Added (%) 0.8 0.8 (1.3) (0.2) 0.6 1.1 MSCI ACWI Return 3 (%) 3.8 3.8 26.4 14.0 15.8 11.2 Value Added (%) 1.4 1.4 5.1 0.2 2.7 4.1
49
50
Nanuk Asset Management Pty Ltd Level 23, Australia Square 264 George Street Sydney NSW 2000 Australia Tel +61 2 9258 1600 Fax +61 2 9258 1699
Dan Powell Head of Distribution Tel +61 2 9258 1612 Mob +61 419 914 212 Email dan.powell@nanukasset.com
This presentation is prepared by Nanuk Asset Management Pty Ltd (‘Nanuk’) (AFS Licence no. 432119) for wholesale clients only. The information contained in this presentation is of a general nature only, does not take into account the objectives, financial situation or needs of any particular person and is not to be taken into account as containing any personal investment advice or recommendation. Before making an investment decision, you should consider whether the investment is appropriate in light of those matters. While this presentation has been prepared with all reasonable care, no responsibility or liability is accepted for any errors, omissions or misstatements however
prospective yields or forecasts referred to in this presentation constitute estimates which have been calculated by Nanuk’s investment team based on Nanuk’s investment processes and research. To the extent permitted by law, all liability to any person relying on the information contained in this presentation is disclaimed in respect of any loss
information in the presentation is not a reliable indicator of future performance. This presentation should not be construed as an offer to sell or the solicitation of an offer to buy any financial services or financial products. This document is confidential, is intended only for the person to whom it has been delivered and under no circumstance may a copy be shown, copied, transmitted or otherwise given to any person other than the authorised recipient. Performance results are shown for illustration and discussion purposes only. EQT Responsible Entity Services Limited (‘EQT’) (ABN 94 101 103 011) AFSL 223271 is the Responsible Entity for the Nanuk New World Fund. This publication has been prepared to provide you with general information only. It is not intended to take the place of professional advice and you should not take action on specific issues in reliance
may contain. Past performance should not be taken as an indicator of future performance. In preparing this information, we did not take into account the investment
whether to invest in this product. Cover image: NASA Earth Observatory image by Robert Simmon, using Suomi NPP VIIRS data provided courtesy of Chris Elvidge (NOAA National Geophysical Data Center). Suomi NPP is the result of a partnership between NASA, NOAA, and the Department of Defense.
51