
SLIDE 1
1
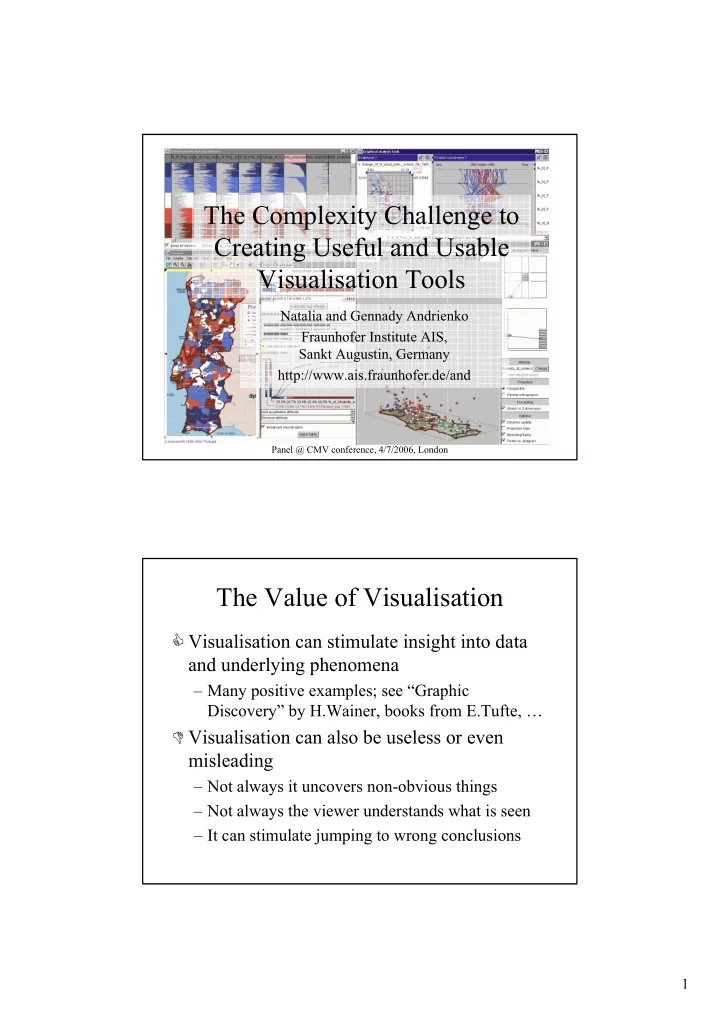
The Complexity Challenge to Creating Useful and Usable Visualisation Tools
Natalia and Gennady Andrienko Fraunhofer Institute AIS, Sankt Augustin, Germany http://www.ais.fraunhofer.de/and
Panel @ CMV conference, 4/7/2006, London
The Complexity Challenge to Creating Useful and Usable - - PDF document
The Complexity Challenge to Creating Useful and Usable Visualisation Tools Natalia and Gennady Andrienko Fraunhofer Institute AIS, Sankt Augustin, Germany http://www.ais.fraunhofer.de/and Panel @ CMV conference, 4/7/2006, London The Value of
Panel @ CMV conference, 4/7/2006, London
– specifically, the example described in the paper about this tool (if any)
– specifically, the example described in the paper about this tool (if any)
a) Animated map b) Map sequence Observations:
values in Poland
Belarus
most countries: great differences between close locations
(we shall look at outliers later)
Observation: no strong similarity between neighbouring places