
SLIDE 1
The Climatology and Interannual Variability of Upward and Downward - - PDF document
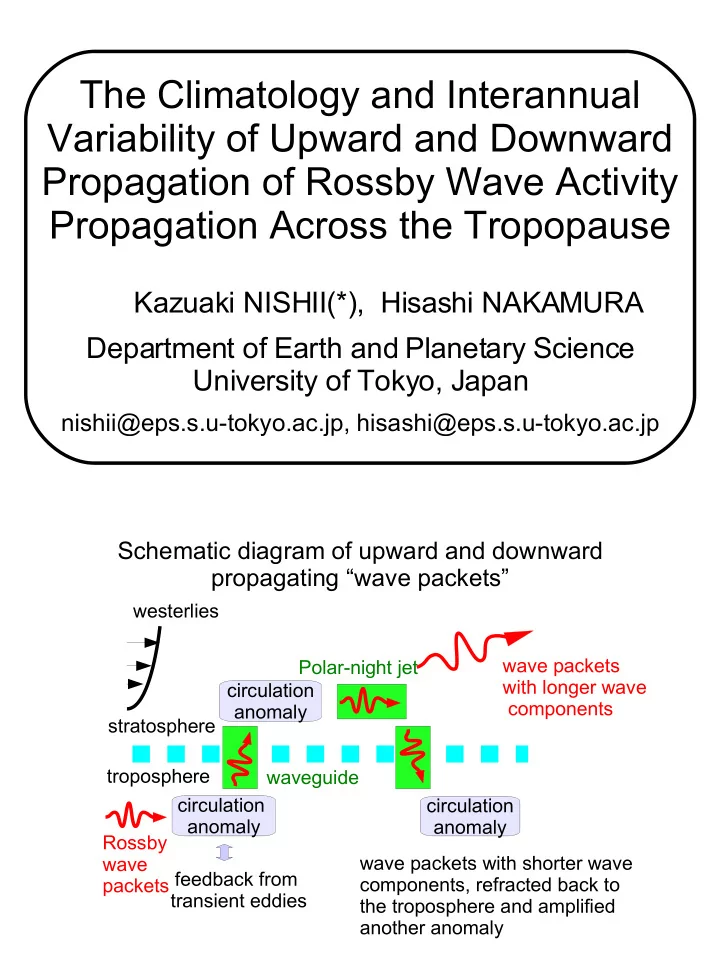
The Climatology and Interannual Variability of Upward and Downward Propagation of Rossby Wave Activity Propagation Across the Tropopause Kazuaki NISHII(*), Hisashi NAKAMURA Department of Earth and Planetary Science University of Tokyo, Japan
– Perlwitz and Harnik (2003, 2004),,,
– Nishii and Nakamura (2005)
– To obtain a picture of climatology and interannual
– To obtain the relationship between wave-packet
– Submonthly fluctuations (time series with 8-days
– variances of geopotential height anomaly
– 3-D wave-activity flux (WAF) defined for zonally
– Parallel with wave-packet propagation
– Taking only positive or negative value of 100-hPa
– Named “Upward only”, “downward only”
2 H0
– Taking active and inactive months of “downward only
– 7 active months (under -0.009[m2/s2]) – 7 inactive months (over -0.0015[m2/s2])
– 6 active months (under -0.009[m2/s2]) – 7 inactive months (over -0.001[m2/s2]) – Then making composite maps and taking the
2=∣∇HQ∣
2
2 H 0 21−4H0N dN −1
2 N d 2 N −1
2
2l 2 f 2
2=k 2nk 2
– (1) Upward wave-activity flux from the trop into
– Axis of the polar-night jet (PNJ) and the subpolar-jet
– Over the Indian Ocean, those quantities are not
– Upward WAF and submonthly fluctuations in the
– Submonthly fluctuations in the tropo is also more
– Stratospheric PNJ shifts poleward and tropospheric
– During “active months”, negatively correlated signal
– The wave guide structure expressed as total
– Similar changes to above mentioned region are
– Upward and downward wave packet propagation
– The former is where submonthly fluctuations both in
– Associated with enhanced downward WAF from the
– Those wind structure change is suggested to give
– Downward propagating wave-packet structure can