
SLIDE 1
The Bumpy Road to the Market’s Long-Term Average
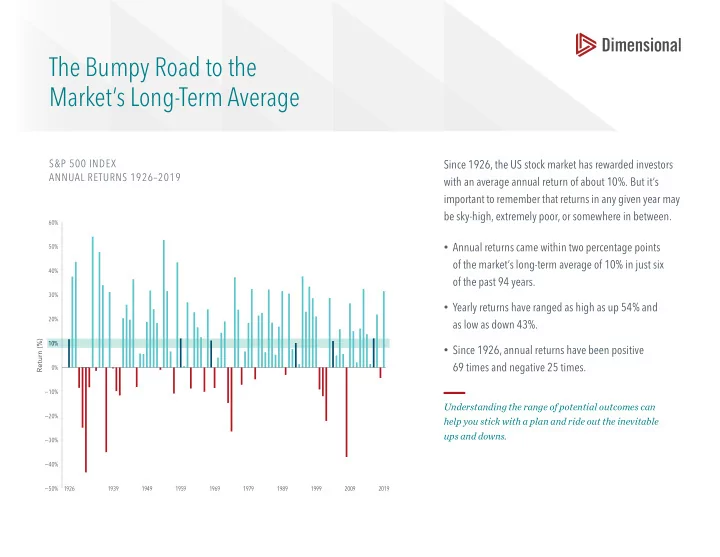
S&P 500 INDEX ANNUAL RETURNS 1926–2019
1926
Return (%)
1939 1949 1959 1969 1979 1989 1999 2009 2019 −50% −40% −30% −20% −10% 0% 10% 20% 30% 40% 50% 60%
Since 1926, the US stock market has rewarded investors with an average annual return of about 10%. But it’s important to remember that returns in any given year may be sky-high, extremely poor, or somewhere in between.
- Annual returns came within two percentage points
- f the market’s long-term average of 10% in just six
- f the past 94 years.
- Yearly returns have ranged as high as up 54% and
as low as down 43%.
- Since 1926, annual returns have been positive
69 times and negative 25 times.
Understanding the range of potential outcomes can help you stick with a plan and ride out the inevitable ups and downs.