The Bead The Bead beadarray: An R Package for beadarray : An R - - PowerPoint PPT Presentation

the bead the bead beadarray an r package for beadarray an
SMART_READER_LITE
LIVE PREVIEW

The Bead The Bead beadarray: An R Package for beadarray : An R - - PowerPoint PPT Presentation

The Bead The Bead beadarray: An R Package for beadarray : An R Package for Illumina BeadArrays Illumina BeadArrays Decoding Hybridisation Mark Dunning - md392@cam.ac.uk Address Probe PhD Student - Computational Biology Group, 23 b 50


slide-1
SLIDE 1

beadarray beadarray: An R Package for : An R Package for Illumina BeadArrays Illumina BeadArrays

Mark Dunning - md392@cam.ac.uk

PhD Student - Computational Biology Group, Department of Oncology - University of Cambridge http://www.bioconductor.org/packages/bioc/1.8/html/beadarray.html

The Hutchison/MRC Research Center
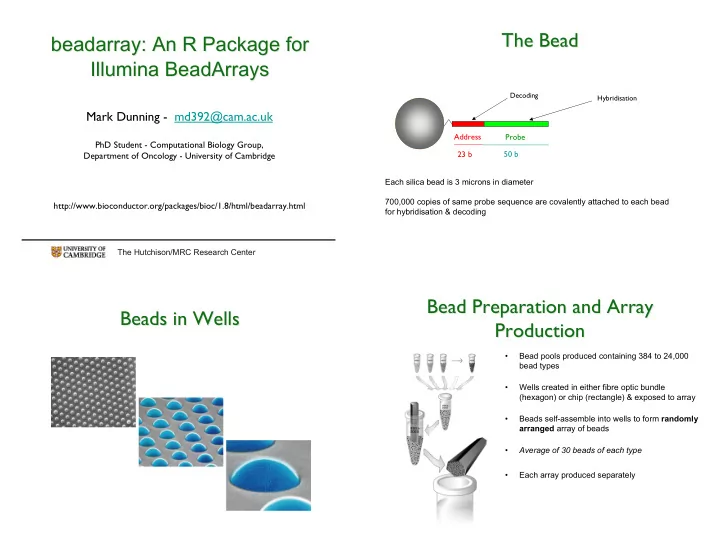
The Bead The Bead

Probe Address 23 b 50 b Each silica bead is 3 microns in diameter 700,000 copies of same probe sequence are covalently attached to each bead for hybridisation & decoding

Decoding Hybridisation

Beads in Wells Beads in Wells

  • Bead pools produced containing 384 to 24,000

bead types

  • Wells created in either fibre optic bundle

(hexagon) or chip (rectangle) & exposed to array

  • Beads self-assemble into wells to form randomly

arranged array of beads

  • Average of 30 beads of each type
  • Each array produced separately

Bead Preparation and Array Bead Preparation and Array Production Production

slide-2
SLIDE 2

Combining Arrays - The SAM Combining Arrays - The SAM

Beads 6 microns apart ~1500 bead types on array ~30 of each type 1 array = 1 sample or treatment 96 arrays processed in parallel - High throughput

The SAM The SAM Combining Arrays - Combining Arrays - BeadChips BeadChips

Whole Genome 6 arrays per chip: 2 strips = 1 array 48,000 bead types (24,000 RefSeq + 24,000 supplemental) on each array RefSeq BeadChip 8 arrays per chip 1 strip = 1 array 24,000 bead types from RefSeq database x 30 reps on each array

Whole Genome TIFF images Whole Genome TIFF images

TIFF image from 1 /12 of one BeadChip 2000 x 19000 pixels ~80MB SAM images ~ 6MB

slide-3
SLIDE 3

Data Formats - Bead Level Data Formats - Bead Level

Bead Level = information about each bead on an array One TIFF for each array - 12 for BeadChip, 96 for SAM The latest version of Illumina scanning software will give information for each bead on an array (BeadStudio will not give this) Output is a csv (Excel) file with 50,000 rows for SAM ~ 1.1 million for BeadChip

Data Formats - Bead Summary Data Formats - Bead Summary

Illumina provide software (BeadStudio) to read raw data and produce a single foreground intensity value for each bead type after outliers have been excluded and background has been removed A single file may be generated describing all arrays in the experiment with arrays listed along the page One row for each gene in the experiment

Current Analysis Methods Current Analysis Methods

Illumina application BeadStudio gives average value for each bead type on the un-logged scale and provides various normalisation and visualisation tools Lose information about 30 replicates of each bead type Data is automatically background corrected. ie No control over image processing

The The ‘ ‘beadarray beadarray’ ’ Library Library

Collection of BeadArray analysis functions written using R Functions for reading SAM and BeadChip data in bead summary or bead level format Options for image processing Also quality control, diagnostic checks and normalisation Compatible with limma, affy packages (uses objects similar to ‘RGList’) http://www.bioconductor.org/packages/bioc/1.8/html/beadarray.html

slide-4
SLIDE 4

BeadLevelList BeadSummaryList

BeadStudio output

Bead Level Analysis Bead Level Analysis Bead Summary Analysis Bead Summary Analysis

TIFF Images + bead level csv files 1 value per bead per array Columns = arrays, 1 row is NOT same probe Image processing inc. background correction Analyse position and intensity of 30 replicates Analysis of outliers Look for spatial effects Normalisation using all beads Many ways to use bead replicates for DE statistics and other analyses. 1 value per bead type per array Columns = arrays, rows = probes Normalisation of bead summary data DE and downstream analysis across arrays based on summary data only.

eSet R ProbeID x y R BeadStDev NoBeads

The The ‘ ‘beadarray beadarray’ ’ Library Library

Computationally expensive tasks are written in C for efficiency Eg Creating BeadLevelList from TIFF and csv files takes around 1 minute* for each strip on a BeadChip - including time taken for image processing Converting from BeadLevelList to BeadSummaryList takes around 2 seconds* for each each array on a BeadChip. However, large amounts of memory (> 1 Gb) are required for these operations

*Running on 3Ghz Pentium IV PC

Bead Level Analysis - Foreground Bead Level Analysis - Foreground and Background and Background

Bead Level Analysis - Outlier Bead Level Analysis - Outlier Analysis Analysis

Illumina say outliers are beads > 3 M.A.D from the mean for their bead type Can plot the position of particular beads or beads of the same type Around 5% total beads on an array are outliers on both SAM and BeadChip technology

slide-5
SLIDE 5

Bead Level Analysis - When Bead Level Analysis - When BeadArrays BeadArrays go wrong go wrong

Array with 12,000 outliers, nearly 25% of beads This array is rare example roughly 1 in 100 arrays are “bad”

Bead Summary Analysis - Bead Summary Analysis - Comparing Arrays Comparing Arrays

“MAXY” plot for comparing multiple arrays SAM summary plot for comparing a measured quantity across all 96 arrays

Further Analysis Further Analysis

Since we have an expression matrix, further analysis can proceed as for other microarray technologies Normalisation can be done using affy package or limma limma provides tools for linear modeling Also clustering, PCA methods can be easily applied We will investigate methods for detecting DE and normalising using the bead level data

Acknowledgements Acknowledgements

Computational Biology Group (Cambridge) Natalie Thorne Mike Smith Isabelle Camilier Simon Tavaré Dermitzakis group (Sanger Institute - Cambridge) Manolis Dermitzakis Barbara Stranger Matthew Forrest Illumina (San Diego) Brenda Kahl Semyon Kruglyak Gary Nunn UCSD(San Diego) Roman Sasik

slide-6
SLIDE 6

References References

http://www.bioconductor.org/packages/bioc/1.8/html/beadarray.html

  • 1. MJ Dunning, NP Thorne, I Camilier, M Smith, S Tavaré.

Quality Control and Low-Level Statistical Analysis of Illumina BeadArrays. Revstat 4:1- 30

  • 2. BE Stranger, M. Forrest, … Genome-wide Associations of Gene Expression

Variation in Humans. PLoS Genet, 1:695-704, 2005

  • 3. KL Gunderson, S Kruglyak, … Decoding randomly ordered DNA arrays. Genome

Res, 14:870-877, 2004

  • 4. K Kuhn, SC Baker, … A novel, high-performance random array platform for

quantitative gene expression profiling. Genome Res, 14:2347-2356, 2004

  • 5. KL Gunderson, FJ Steemers, … A genome-wide scalable SNP genotyping assay

using microarray technology. Nat Genet, 27:549-554, 2005

  • 6. M Barnes, J Freudenberg, … Experimental comparison and cross-validation of the

Affymetrix and Illumina gene expression analysis platforms. Nucleic Acids Res, 33:5914-5923, 2005