
SLIDE 1
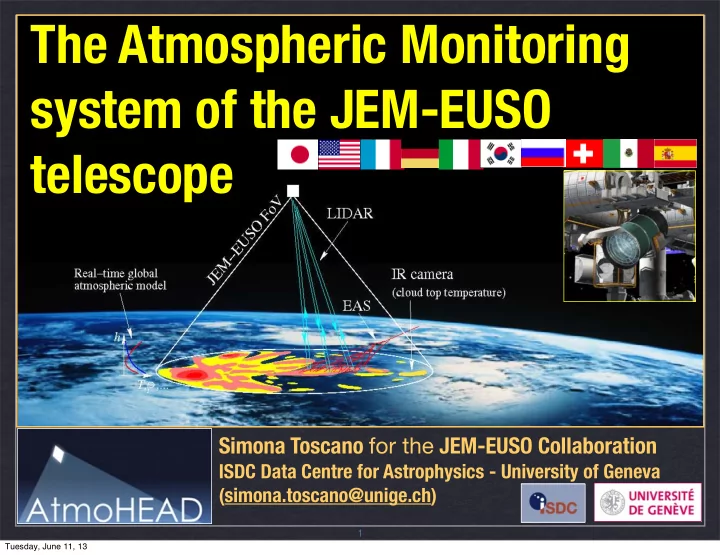
The Atmospheric Monitoring system of the JEM-EUSO telescope
Simona Toscano for the JEM-EUSO Collaboration
ISDC Data Centre for Astrophysics - University of Geneva (simona.toscano@unige.ch)
1
Tuesday, June 11, 13
The Atmospheric Monitoring system of the JEM-EUSO telescope Simona - - PowerPoint PPT Presentation
The Atmospheric Monitoring system of the JEM-EUSO telescope Simona Toscano for the JEM-EUSO Collaboration ISDC Data Centre for Astrophysics - University of Geneva (simona.toscano@unige.ch) 1 Tuesday, June 11, 13 Outline General
Simona Toscano for the JEM-EUSO Collaboration
ISDC Data Centre for Astrophysics - University of Geneva (simona.toscano@unige.ch)
1
Tuesday, June 11, 13
2
Tuesday, June 11, 13
2
Tuesday, June 11, 13
Cosmic rays above ~1018-1019 eV are believed to have extra- galactic origin. The highest observed cosmic ray energy is ~3x10²⁰ eV (108 times higher than LHC energy scale). It is above the GZK cutoff (due to interaction of UHCRs with CMB). Most of the candidate sources are incapable of accelerating particle beyond the GZK limit. The origin of UHECRs is still an open question.
JEM-EUSO SCIENCE
from Lawrence’s talk on Monday 3
Tuesday, June 11, 13
Extreme Universe Space Observatory on board the Japanese Experiment Module
A new space-based (ISS) mission to study the origin and nature of UHECRs. Main objectives:
Exploratory science:
4
Tuesday, June 11, 13
Detection of UV light emitted by EAS initiated by primary UHECRs hitting the Earth’s atmosphere (our detector) Fluorescence light (secondary electrons exciting N2) emitted isotropically along the EAS track and observed directly. Cherenkov light is forward-beamed. It’s observed because
Properties of UHECR particles (arrival direction, energy, type) are derived from the properties of the detected light.
Adams Jr.,J.H. et al. (2013), An evaluation of the exposure in nadir
76-90 (2013)
Photons flux at the entrance aperture:
(thousands of them reaching the pupil)
smaller contribution from reflected and back- scattered Cherenkov
corrections for the Cherenkov component
5
Tuesday, June 11, 13
Proper measurement of UHECRs properties can be achieved only knowing the condition of the detector (atmosphere). Intensity of the observed light depends on the transmittance (absorption and scattering properties) of the atmosphere, the cloud cover and clouds properties (height, optical depth...), and aerosols.
LIDAR profile from the CALIPSO spacecraft, specifically the 523 nanometer Total Attenuated Backscatter. Credit: NASA Langley Research Center.
AEROSOL LAYERS CIRRUS CLOUDS OPTICALLY THICK CLOUDS MOLECULAR SCATTERING
6
Tuesday, June 11, 13
JEM-EUSO will experience all possible weather conditions (ISS moves with v~7 km/sec). State of the atmosphere is continuously changing in
LIDAR profile from the CALIPSO spacecraft, specifically the 523 nanometer Total Attenuated Backscatter. Credit: NASA Langley Research Center.
AEROSOL LAYERS CIRRUS CLOUDS OPTICALLY THICK CLOUDS MOLECULAR SCATTERING
7
Tuesday, June 11, 13
The AM system will continuously monitor the atmosphere in JEM-EUSO FoV during data taking period. INFRARED CAMERA:
information on cloud cover and measurement of top altitude of optically-thick clouds
LIDAR:
detection of thin clouds with and aerosol layers
GLOBAL MODELS:
physical parameters of the atmosphere from weather forecasting services such as NCEP , GMAO, ECWMF .
SLOW MODE DATA: additional information on cloud distribution and intensity of the
night sky airglow
8
Tuesday, June 11, 13
Only 30% of events will develop in clear sky Events occurring in the remaining 70% will be rejected if not corrected for the presence of clouds. Minimal task of the AM system: to provide a selection criteria for golden events (no detection of clouds from LIDAR or IR camera). More advanced: correction for cloud-affected shower profiles for simple cases (i.e. low-altitude optically thick clouds).
<3.2 3.2-6.5 6.5-10 >10 <0.1 31% <0.1% <0.1% 1.2% 0.1-1 6.4% 2.0% 3.2% 5.0% 1-2 6.0% 3.0% 4.2% 2.5% >2 16% 6.0% 8.5% 5.0%
ALTITUDE (KM) OPTICAL DEPTH
TOVS DATA
9
Tuesday, June 11, 13
Cirrus case: signal attenuation according to the optical depth (𝜐) leads to an error in the estimation of the energy Stratus case: EAS observed w/o attenuation (cloud top below the region of development); strong Cherenkov reflection on the top of cloud instead of ground leads to an error in the geometry reconstruction and particle identification.
H ¡= ¡2.5 ¡km, ¡𝜐 ¡= ¡5 H ¡= ¡10 ¡km, ¡𝜐 ¡= ¡0.05 PROFILE IN CLEAR SKY
General requirements on the precision of the UHECRs measurement (∆E/E < 30%, Xmax < 120 g/cm2) impose the requirements on the precision of the atmospheric measurement:
Δ𝜐 ¡≤ ¡0.15
Saez%et%al.%Proc.%TAUP%2011%
10
Tuesday, June 11, 13
Micro-bolometer based infrared imaging system for cloud coverage and cloud top altitude measurements. Three main blocks:
counts;
control and secure communication with the platform computer;
Challenging mechanical and thermal design to secure IR-Camera isolation.
Towards the Preliminary Design Review of the Infrared Camera of the JEM-EUSO Space Mission, M.D. Rodriguez Frias for the JEM-EUSO Collaboration, ICRC proceedings 2013.
11
Tuesday, June 11, 13
Two approaches for Cloud Top Height (CTH) that can support each other:
and altitude, extra info are necessary;
Towards the Preliminary Design Review of the Infrared Camera of the JEM-EUSO Space Mission, M.D. Rodriguez Frias for the JEM-EUSO Collaboration, ICRC proceedings 2013.
12
Tuesday, June 11, 13
No direct measurement: observed radiation is related to the cloud temperature and emissivity (Lmeasured ➯Tretrieved) (radiance is the measurement) The atmosphere between the emitter and the sensor absorbs and emits energy:
LCLOUD ≠ LMEASURED TCLOUD ≠ TRETRIEVED
Algorithms needed to infer the cloud temperature (Tcloud) from the temperature measured (Tmeasured) by the IR camera. Different clouds (emissivity, water and ice content...) need different algorithms (Split Window Algorithm, Look-Up Tables, Brightness Temperature Difference).
13
Tuesday, June 11, 13
SWA is able to retrieve temperature with high accuracy (~1 K) for optically thick water clouds (ε = 1) Work still in progress for thin clouds, broken clouds, clouds of ice [LUTs, BTD]
CLOUD&PHASE& MODIS&product&
Blue - Water Cyan - Ice Yellow - Mixed Red - Unknown South Hemisphere Sur (Pacific Ocean) Latitud [40S, 60S ] - Longitud [160W, 120W] Date: 16/05/2012. Hour: 09:55 UTC.
CLOUD TOP TEMPERATURE ERROR
SWA WITH REAL DATA
14
Tuesday, June 11, 13
The JEM-EUSO Stereo System
The stereo imaging is accomplished by one camera moving along the
imaged from two different views and the intersection is processed to retrieve the distance from the IR device (depth). The stereo images are acquired in two different bands.
Cloud top Height Reconstruction
The depth of each point is recovered by triangulating the corresponding pairs of projected pixels. Finally the heights of each pixel is calculated subtracting the depth value from the ISS altitude. Parallax effect (Disparity) is crucial for the reconstruction. It appears as an apparent cloud motion on the image plane.
Multispectral stereo algorithms are currently under
shown for a 'mono band stereo system' composed by the Meteosat Second Generation geostationary satellites MSG-8 and MSG-9. The same grey level, represent points with the same
configuration and sensors
15
Tuesday, June 11, 13
The task of the LIDAR is to provide measurements of the scattering and extinction properties of the atmosphere in the region of the EAS development and between the EAS and JEM-EUSO. The transmission system comprises a Nd:YAG laser and a pointing mechanism to steer the laser beam in the direction of the EAS. JEM-EUSO will be used a receiver.
16
Tuesday, June 11, 13
Similar laser as for the laser ranging devices in satellites for atmospheric soundings (CALIPSO, LITE, ...) Operational wavelength (355 nm) is the 3rd harmonic of the Nd:YAG laser 3rd harmonic is conventionally achieved with the frequency-tripling crystal placed inside the laser beam Steering of the laser done with a mirror system. Mirror size: 4 mm X 4 mm. Tilt angle of the mirror determined by the electric current in the magnet (±15˚ steering angle needed to achieve the ±30˚ pointing). Footprint of the laser beam ~ 1 km (one to several pixels in JEM-EUSO telescope) achieved with a beam expander (beam conditioning optics). Properties of the atmosphere averaged
17
Tuesday, June 11, 13
Properties of the LIDAR backscattered signal (@355 nm) are similar to the properties
Any pixel or group of pixels from the last triggered PDM (Photo-Detector Module) of the JEM-EUSO focal surface will serve as the LIDAR receiver. EAS trigger generated in a PDM will also generate a command to re-point and shoot the laser. After a certain delay the pixels of the PDM will be switched in receiving mode. The region of the atmosphere around the EAS will be probed by the LIDAR within ~ 300 ms starting from the initial EAS trigger. The ~1sec time delay between the EAS trigger and the LIDAR measurement is ~10 times shorter than time between subsequent EAS triggers. The rest of time interval will be used to shoot the LIDAR in several directions around the EAS position.
18
Tuesday, June 11, 13
Simulation chain used to reproduce a real-case observation: EAS time profile shows deviations from the clear sky and needs to be corrected. UHECR: proton, E=1020 eV, θ = 60˚ simulated in clear sky and cloudy conditions. Cloud: uniform layer with HTop = 7 km, τ = 1
Time profile of the detected photo-electron signal as a function of GTU* for the shower in clear sky (blue) and in presence of an
GROUND MARK Ground mark: generated by Cherenkov photons hitting the ground and reflected back to the JEM-EUSO focal surface. Cloud mark: generated by Cherenkov photons hitting the cloud and reflected in the cloud top layers back to the JEM-EUSO focal surface. *GTU (Gate Time Unit) is the time unit of the focal surface detector: 1 GTU = 2.5 μsec
19
Tuesday, June 11, 13
LIDAR signal simulated in the same conditions as for the shower (in a real case the LIDAR will shoot the triggered EAS to collect info on atmospheric conditions). Comparison of the detected signal with a reference (clear sky) will allow to:
in clear sky will be golden)
the signal as it would be in clear sky. Fitting the Scattering ratio:
CLOUD MARK
allow to retrieve:
(τ = 1 simulated)
20
Tuesday, June 11, 13
Once the cloud is detected and its optical depth measured the shower profile can be corrected using:
No reconstruction in the cloud region: no information about the optical depth profile inside the cloud. Ground mark almost recovered by the correction procedure.
21
Tuesday, June 11, 13
Once the cloud is detected and its optical depth measured the shower profile can be corrected using:
No reconstruction in the cloud region: no information about the optical depth profile inside the cloud. Ground mark almost recovered by the correction procedure. Just an example of possible scenario. Ongoing work to qualify the type and quantify the number of events we will be able to correct using information from the AM system (important for duty cycle estimations)
21
Tuesday, June 11, 13
JEM-EUSO is a new space-based (ISS) mission to study the origin and nature of UHECRs (above 5x10¹⁹ eV) Looking downward to the Earth’s atmosphere for EAS detection, It will experience all possible weather conditions. The AM system will be used to monitor the atmospheric condition in the region of development of the EAS with this requirements:
First study of IR camera algorithms shows the possibility of retrieving the temperature of thick water clouds with high accuracy. First analysis of LIDAR (simulated) data show the capabilities of reconstructing the EAS profile for cloud-affected showers. GLS (Global Light System) as a part of the JEM-EUSO calibration system will serve as a complement for the AM system [see Sarazin’s talk on GLS].
22
Tuesday, June 11, 13
Atmospheric state variable such as the density of the air, alter the development
Knowledge on the atmospheric condition influence the event reconstruction. Data from LIDAR and IR camera can be improved from the knowledge of the physical properties of the atmosphere (i.e. IR camera radiometric cloud top altitude retrieval requires knowledge of the vertical temperature profile in the troposphere; an estimate of the molecular scattering based on the Rayleigh cross section and altitude profiles of temperature and pressure are needed to model the LIDAR signal in clear sky). Data products from global model developed by NCEP , GMAO, ECWMF available
23
Tuesday, June 11, 13
The GDAS provides an analysis four times a day (00, 06, 12, and 18 UTC) and 3, 6, and 9-hour forecasts. GDAS data set contains several state variables as a function of the altitude in form of pressure levels from 1000 hPa (sea level) to 20 hPa (∼ 26 km). Data are distributed in a latitude-longitude (181◦× 360◦) grid of 1◦ spacing NCEP/GDAS (http://ready.arl.noaa.gov/gdas1.php) data have been successfully incorporated in JEM-EUSO simulation of air showers.
A plot of GDAS output showing total atmospheric ozone at 00UTC on February 1st, 2012. Credit: NOAA
The Global Data Assimilation System (GDAS) is the system used by the Global Forecast System (GFS) model to place
starting, or initializing, weather forecasts with observed data. Observations used: surface observations, balloon data, wind profiler data, aircraft reports, buoy observations, radar
24
Tuesday, June 11, 13
The energy of the laser pulse will be adjusted so that the backscattered signal will have enough statistics for the detection and measurement of the
Minimum energy per pulse needed by the LIDAR in
Minimum energy per pulse needed to detect a clouds (with τ = 0.15) at 5 km (squares) and 10 km (circles) for different inclinations of the laser beam REQUIREMENT
τ = 0.15
25
Tuesday, June 11, 13
Continuous background photon counting Uses two pixel lines of the FS, aligned across the track direction: 528 pixels per line used to generate UV cloud (stereo-)image: The same area seen by the “forward” pixel line is then seen by the “backward” line after a fixed time delay It will provide measurement of the
sky airglow (weak emission of light from a planetary atmosphere) Reflection of the airglow from the clouds (in UV) could be used to complement information from IR camera.
26
Tuesday, June 11, 13
27
Tuesday, June 11, 13