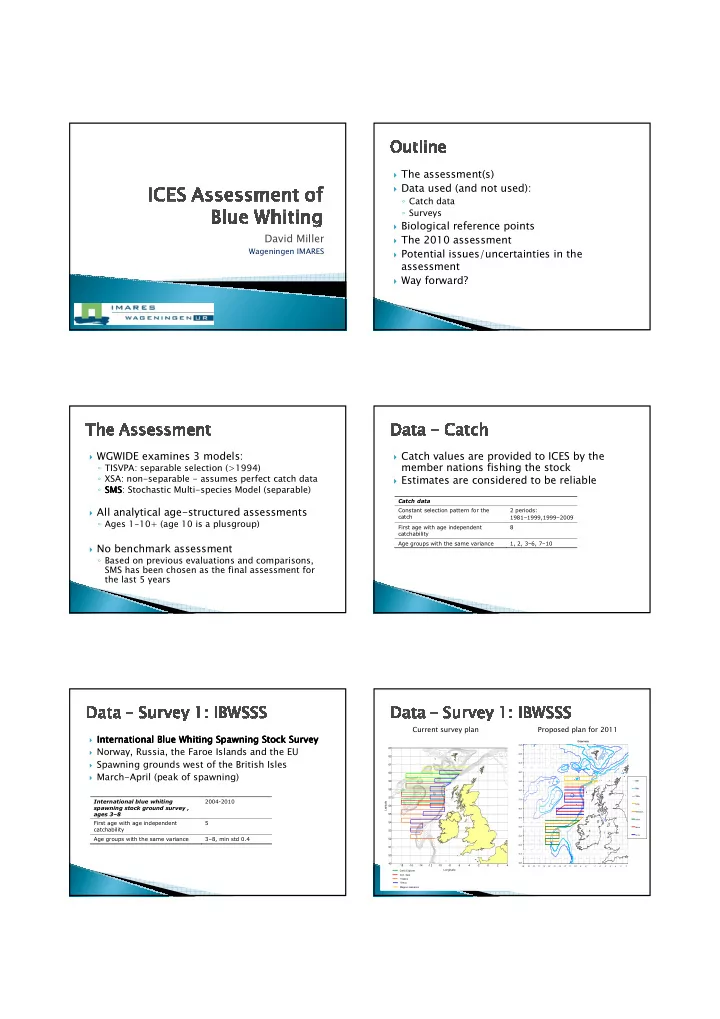
the assessment s data used and not used
play

The assessment(s) Data used (and not used): Catch data Surveys - PDF document

The assessment(s) Data used (and not used): Catch data Surveys Biological reference points David Miller The 2010 assessment Wageningen IMARES Potential issues/uncertainties in the assessment Way forward? WGWIDE


  1. � The assessment(s) � Data used (and not used): ◦ Catch data ◦ Surveys � Biological reference points David Miller � The 2010 assessment Wageningen IMARES � Potential issues/uncertainties in the assessment � Way forward? � WGWIDE examines 3 models: � Catch values are provided to ICES by the member nations fishing the stock ◦ TISVPA: separable selection (>1994) ◦ XSA: non3separable 3 assumes perfect catch data � Estimates are considered to be reliable ◦ SMS SMS SMS: Stochastic Multi3species Model (separable) SMS ���������� � � All analytical age3structured assessments Constant selection pattern for the 2 periods: catch 1981–1999,1999–2009 ◦ Ages 1310+ (age 10 is a plusgroup) First age with age independent 8 catchability � No benchmark assessment Age groups with the same variance 1, 2, 3–6, 7–10 ◦ Based on previous evaluations and comparisons, SMS has been chosen as the final assessment for the last 5 years Current survey plan Proposed plan for 2011 � International Blue Whiting Spawning Stock Survey International Blue Whiting Spawning Stock Survey International Blue Whiting Spawning Stock Survey International Blue Whiting Spawning Stock Survey Cruise tracks 63.0° � Norway, Russia, the Faroe Islands and the EU 63 62.0° 62 � Spawning grounds west of the British Isles 61.0° 61 � March3April (peak of spawning) 60 60.0° 59 200m 59.0° 58 500m 58.0° 1000m 57 ��������������������������� 2004'2010 57.0° Latitude Faroes ������������������������������� 56 56.0° �������� Netherlands 55 55.0° Ireland First age with age independent 5 54 catchability 54.0° Norway 53 Russia Age groups with the same variance 3–8, min std 0.4 53.0° 52 52.0° 51 50 51.0° 49 50.0° -18 -16 -14 -12 -10 -8 -6 -4 -2 0 2 4 -20° -19° -18° -17° -16° -15° -14° -13° -12° -11° -10° -9° -8° - 7° -6° -5° -4° -3° -2° -1° Longitude Celtic Explorer G.O. Sars Tridens Vimus Magnus Heinason

  2. � International Ecosystem Survey in the Nordic International Ecosystem Survey in the Nordic International Ecosystem Survey in the Nordic International Ecosystem Survey in the Nordic � Primary source of information about the current Seas Seas state of the stock Seas Seas � EU, Norway, the Faroe Islands and Russia � Covers a large area ◦ Not always well standardised � Barents Sea, north & central Norwegian Sea ◦ Limited time and southwestern Norwegian Sea (Faroese ◦ Migrations occur during the survey and Icelandic Zones) ◦ Weather conditions often unfavourable � May � Short time series ◦ ‘catchability’ estimates still variable ���������������������������������� 2000'2010 ��������������� , �������� ◦ In a transition phase, should stabilise in the future First age with age independent 2 catchability Age groups with the same variance � 1,2 Trawls Stations � Blue Whiting is not the primry target of the survey � Generally small and loose registrations of blue whiting � Used as an index of recruitment (incoming year3class strength) � Norway � Norway, some years in co3ordination with � Spawning grounds west of the British Isles Russia � Precursor for IBWSSS � Barents Sea � 199132006 � late January‐early March ◦ 200432006 incorporated in IBWSSS � Only used in forecast Only used in forecast Only used in forecast Only used in forecast ◦ 2007 onwards: Norwegian contribution to IBWSSS ◦ Coverage on edge of the distribution area changed ◦ Considered first reliable indication of year3class �������������������������� 1993–2003 strength (recruitment) ������ , �������� First age with age independent 5 catchability Age groups with the same variance � 3–4, 5–6, 7–8

  3. � NOT USED IN THE CURRENT ASSESSMENT NOT USED IN THE CURRENT ASSESSMENT NOT USED IN THE CURRENT ASSESSMENT NOT USED IN THE CURRENT ASSESSMENT � Spanish pair trawls CPUE ◦ 198332003 � Only representative for a small part of the ◦ Discontinued because fleet only represents a small stock: part of the landings in a small part of the ◦ Spanish bottom trawl survey distribution area ◦ Portuguese bottom trawl survey � Norwegian CPUE � Patchy temporal coverage / not updated: ◦ 198232003 ◦ Norwegian Sea summer survey (1981–2001, 2005–2007) ◦ Not updated ◦ Faroes plateau spring bottom trawl survey (1996–2008) ◦ Not considered representative of the development ◦ Faroes plateau autumn bottom trawl survey (1994–2008) of the stock Type Name Year range Age range Variable from year to year � History : Yes/No Caton Catch in tonnes 1981 – 2009 1'10 Yes ◦ SGPA 1998: Canum Catch at age in 1981 ' 2009 1'10 Yes � Blim = 1.5 million t (~lowest observed at the time) numbers � Flim=Floss=0.32 Weca Weight at age in the 1981 – 2009 1'10 Yes commercial catch � Bpa (2.25 Mt) and Fpa (0.21) arbitrarily calculated up from these West Weight at age of the 1981 – 2009 1'10 Yes � Simulations suggested in absence of clear stock3recruit spawning stock at relationship spawning time. Mprop Proportion of natural 1981 – 2009 1'10 No mortality before ◦ ACFM 1998 spawning � Fpa=0.32 (avg. F, no apparent neg. effects on rec.) Fprop Proportion of fishing 1981 ' 2009 1'10 No mortality before � Flim raised to 0.51 spawning Matprop Proportion mature 1981 ' 2009 1'10 No ◦ SGPRP 2003: at age Natmor Natural mortality 1981 ' 2009 1'10 No � Bloss=1.2 Mt, similar to current Blim, assessments still unstable Tuning data: – no change Type Name Year range Age range Tuning fleet 1 Norwegian Acoustic Survey 1991'2003 3'8 Tuning fleet 2 International Ecosystem Survey 2000 ' 2010 1'2 Tuning fleet 3 International Spawning Stock Survey 2004 ' 2010 3'8 � History: � History: ◦ ACFM 2006 ◦ MP simulation evaluation 2008 � Using Bpa as a trigger expected to lead to a >5% risk � high risk of stock collapse for F > 0.3 of SSB dropping below Blim � F0.1=0.18, low risk to stock � Suggests Bpa should be higher � Current BRPs: ◦ WKREF 2007 � In the period of low recruitment there seems to be no Reference Point B ��� � B �� F ��� � F �� sign of reduced recruitment at low SSB Value 1.5 mill t 2.25 mill t 0.51 yr '1 0.32 yr '1 � In the period of high recruitment no apparent trend in Basis B ���� Blim*exp(1.645* σ) F ���� F ��� With σ = 0.25 recruitment over the range of biomass � May be no need for different B lim values in different productivity regimes

  4. � WGWIDE – assessment working group on widely distributed and highly migratory stocks � Vigo, Spain � Aug/Sep 2010 � Participants include scientists from almost all countries fishing the stock Catch proportion at age for Blue whiting al 10 Area 8 6 age 4 Season 2 1980 1985 1990 1995 2000 2005 2010 year Planned Realised � Deviations from pre3agreed survey plan: ◦ Temporal: Russian component 2 weeks late 63 � Excluded from survey (risk of ‘double counting’) 62 61 ◦ Spatial: Dutch component incomplete due to poor 60 weather 59 � Gap in area coverage occurred in an area of concentrated 58 fishing effort and thus likely to have contained a high but 57 un3 un un un 3quantified 3 3 quantified biomass quantified quantified Latitude 56 � Interpolated (estimated) from surrounding surveyed areas 55 54 � WGNAPES considered the revised estimate to 53 52 be robust and recommended WGWIDE to use 51 these values 50 49 -18 -16 -14 -12 -10 -8 -6 -4 -2 0 2 4 Longitude Celtic Explorer G.O. Sars Tridens Vimus Magnus Heinason

  5. 2009 2010 � 2010 mean acoustic density the lowest observed since 2004 62° ◦ 50% decrease in stock biomass compared to the 2009 survey 60° sA - values 58° 0 - 100 100 - 500 500 - 1000 1000 - 141000 56° 54° 52° 50° 20° 16° 12° 8° 4° 0° 4° � Largest coordinated coverage in the # International Norweigian Sea Norwegian Sea and surrounding waters in ecosystem survey 2000-2009 # Effort and catch numbers summer ever age 1 age 2 48927 3133 #2000 � Small and loose registrations of blue whiting 85772 25110 #2001 15251 46656 #2002 � Generally colder in the Norwegian Sea, but 35688 21487 #2003 49254 22086 #2004 extremely warm Atlantic water masses in the 54660 19904 #2005 southern and southwestern part of Iceland 570 18300 #2006 21 552 #2007 29 75 #2008 0 14 #2009 0 0 #2010 � Close agreement in 3 models: Recruitment (age 1 yr) Fishing mortality 70 0.7 60 0.6 SMS 50 0.5 Recruits, *10^9 TISVPA 40 XSA 0.4 F 3-7 30 0.3 20 0.2 10 0.1 0 0 1980 1983 1986 1989 1992 1995 1998 2001 2004 2007 1980 1983 1986 1989 1992 1995 1998 2001 2004 2007 Spawning stock biomass 8 7 6 SSB (million t) 5 4 3 2 1 0 1980 1983 1986 1989 1992 1995 1998 2001 2004 2007

Download Presentation
Download Policy: The content available on the website is offered to you 'AS IS' for your personal information and use only. It cannot be commercialized, licensed, or distributed on other websites without prior consent from the author. To download a presentation, simply click this link. If you encounter any difficulties during the download process, it's possible that the publisher has removed the file from their server.

Recommend


More recommend