
SLIDE 1
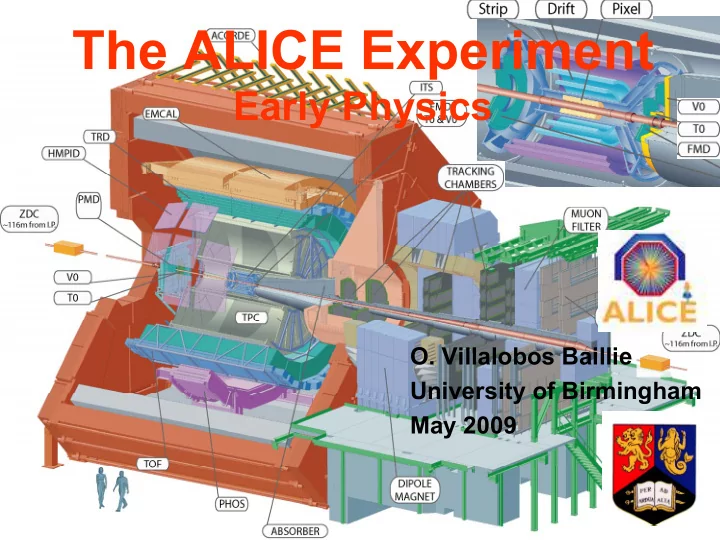
The ALICE Experiment
Early Physics
- O. Villalobos Baillie
University of Birmingham May 2009
The ALICE Experiment Early Physics O. Villalobos Baillie - - PowerPoint PPT Presentation
The ALICE Experiment Early Physics O. Villalobos Baillie University of Birmingham May 2009 Plan of Talk The LHC energy regime Introduction to the ALICE detector Performance examples from 2008 First Physics
University of Birmingham May 2009
2
3
Plasma (QGP)
symmetry restoration
ALICE is well suited
4
Lattice QCD, μB = 0 Lattice QCD, μB = 0
Both statistical and lattice QCD predict that nuclear matter will undergo a phase transition at a temperature of, T ~ 170 MeV and energy density, ε ~ 1 GeV/fm3.
5
– LHC (Pb collisions): reaches higher energy than previous experiments, makes hotter collision and increased number of newly produced partons. – E DENSITY MUST BE >1 GeV/fm-3 to form QGP Baryo-chemical potential relates to the local net density of valence quarks
Baryo-chemical Potential (µ)
Critical point Quark Gluon Plasma T , ~170
crit
Hadronic matter Colour superconductor Crossover region Nuclear matter ~1 GeV ? Neutron stars
QUARK GLUON PLASMA
Cold QGP In this region, high baryo-chemical potential, QGP formed by compressing nuclear matter
ALICE will look at Pb collisions to observe QGP “signatures”
6
... factor ~30 jump in √s ...
<0.2 ~0.5 ~1 τ0 (fm/c) 4–10 1.5–4.0 <1 τQGP (fm/c) 2x10⁴ 7x10³ 103 Vf (fm3) 15–40 4–5 2.5
ε
(GeV/fm3) 2–8 x10³ 850 500 dNch /dy 5500 200 17 s1/2(GeV) LHC RHIC SPS Central collisions
“ hotter - bigger -longer lived ”
εLHC > εRHIC > εSPS Vf LHC > Vf RHIC > Vf SPS τLHC > τRHIC > τSPS
7
contribute significantly to the total AA cross- section (σhard/σtot = 98%) – Bulk properties dominated by hard processes – Very hard probes are abundantly produced LHC
RHIC
SPS
(h++h-)/2 π0
17 GeV 200 GeV 5500 GeV = √s
LO p+p y=0
8
density and the parton transverse sizes increase, there must be a regime (at q2 <Qs
2) where partons overlap. When this happens,
the increase in the number of small x partons becomes limited by gluon fusion.
109 Q = M 108 107 106 105 104 103 102 101 100 10-7 10-6 10-4 10-5 10-3 10-2 10-1 100 x Q2 [GeV2]
x1.2 = (M/14 TeV) exp (–y) M = 10 TeV M = 1 TeV M = 100 GeV M = 10 GeV
HERA LHC fixed target y = 6 6 4 4 2 2
Y J/ψ
LHC
What is new at LHC is that this overlap should occur for relatively high pT partons ~ 1 GeV/c (Kharzeev Qs
2 ~ 0.7 GeV2), where the effect must be visible
10
From RHIC to LHC xmin ~ 10-2
– factor 1/30 due to energy – factor 1/3 larger rapidity
With J/ψ at rapidity 4
– Pb-Pb collisions xmin ~ 10-5 – pp collisions xmin ~ 3×10⁻⁶
11
From RHIC to LHC
ε0 = dN/dy <E⊥ >/τ0 4πR2 – increase by factor 2–3 QGP lifetime – increase by factor 2–3
12
Alice year:
Collision system pp PbPb √sNN (TeV) L0 (cm-2s-1) <L>/L0 (%) Run time (s/year) σinel (b) 14.0 1031* 107 0.07 5.5 1027 70-50 106 * * 7.7
* Lmax
(ALICE) = 1031 cm-2s-1 ** ∫ L dt (ALICE) ~ 0.7 nb-1/year
13
Sweden Poland Norway Russia JINR Japan Brazil Romania Spain/Cuba South Africa USA China Croatia Armenia India Korea Ukraine Mexico Czech Rep. Slovak Rep. CERN Denmark Finland Germany France Italy Greece UK Hungary Netherlands
~ 1000
Members
(63% from CERN MS)
~30
Countries
~100
Institutes
~150
MCHF capital cost (+ inherited magnet)
A brief history of ALICE
1990-1996: Design 1992-2002: R&D 2000-2010: Construction 2002-2007: Installation 2008 -> : Commissioning
UK
14
Size: 16 x 26 meters Weight: 10,000 tons Detectors: 18
15
– Silicon Pixels (RD19) – Silicon Drift (INFN/SDI) – Silicon Strips (double sided) – low mass, high density interconnects – low mass support/cooling
–gas mixtures (RD32) –new r/o plane structures – advanced digital electronics – low mass field cage
– new scint. crystals (RD18)
– Pestov Spark counters – Parallel Plate Chambers – Multigap RPC's (LAA) – low cost PM's – CsI RICH (RD26)
– scalable architectures with COTS – high perf. storage media – GRID computing
– micro-channel plates – rad hard quartz fiber calo. – VLSI electronics
? ?
RHIC RHIC RHIC RHIC
16
17
19
20
21
23
Yoke Assembly completed 19 Feb 2004
24
25
The beginning of 2005 was dominated by moving the Muon magnet into the final position
26
27
28
29 29
< 100 m horizontal, < 100 m vertical in 2 days <v> = 4 m/hour Position Monitor
TPC Installation (January 2007)
30
ITS Installation 15.3.07
31
Formal end of ALICE installation: July 2008
32
(charged particles)
µ arm
< 0.9 – 2 π tracking, PID – single arm RICH (HMPID) – single arm em. calo (PHOS) – jet calorimeter (proposed)
arm 2.4 < η < 4 – absorber, 3 Tm dipole magnet 10 tracking + 4 trigger chambers
< 3 – including photon counting in PMD
dets – T0: ring of quartz window PMT's – V0: ring of scint. Paddles
33
hadrons (π, K, p): 100 MeV/c < p < 5 GeV/c; (π and p with ~ 80 % purity to ~ 60 GeV/c)
in silicon (ITS) and gas (TPC) + time-of-flight (TOF) + Cherenkov (RICH)
), photons, π0
in PHOS: 1 < p < 80 GeV/c
34
34
– Pixels (SPD), Drift (SDD), Strips (SSD)
Status: installed; being commissioned
35
35
Inner Tracking System
~ 10 m2 Si detectors, 6 layers Pixels, Drift, double sided Strips
Strips SSD Drift SDD Pixels
Pixels SPD
36
37
drift gas
Ne - CO2 – N2 (86/9/5)
Field Cage
88m3, l=5m, d=5.6m 570 k channels HV membrane (25 μm)
38
39
16 May 2006 16 May 2006 First cosmic and laser tracks !
40
at low momentum dominated by
at high momentum determined by
(which is here assumed ideal) central Pb–Pb pp
Transverse Momentum(GeV/c) 10 20 30 40 50 60 70 80 90 100 Transverse momentum resolution (%) 1 2 3 4 5 6 ITS + TPC ITS + TPC +new TRD
central Pb–Pb pp
41
transverse momentum resolution, B=0.5 T resolution at 10 GeV First round alignment: measured 6.0% (design 4.5%) particle identification via dE/dx Resolution first round cal.: measured 5.7% (design 5.5%)
2008.
recorded.
and alignment
performance already approaching design value
Analysis of cosmics Poster B. Allessandro
41
Alice preliminary Alice preliminary
42
despite low statistics
Very preliminary Single hit resolution σ /√2 = 130 ps EXPECT <80ps WHEN CALIBRATION FINISHED
(QM09 P. Antonioli)
43
ALICE CTP features:
groups – e.g. muon arm and central barrel
tens of interactions in TPC drift time
physics analysis: trigger correction, high multiplicity,…
44
45
46
runs (24/7)
– Cosmics I (2 w eeks, Dec 2007)
commissioning
– Cosmics II (3 w eeks, Febr/Mar 2008)
magnet commissioning
– Cosmics III (since May 2008 continuous operation 24/7)
– TI2 dump in June , injection tests August, first circulating beam September –
during injection through ALICE
TI2
– SPD, V0 alw ays on (trigger), – SSD, SDD, FMD, T0 occasionally – (beam w as useful only for a small subset of detectors !)
48
B=0.5T C.Bombonati
pT [GeV/c]
TPC
M.Ivanov, July08 positive negative
49
49 49
14 June 15 June ALICE Pixels
Federico Antinori, SQM2008
50
8 August 2008
ALICE SPD (pixel) and V0 ( V0 (scintillator scintillator) ) switched on during first switched on during first phase (upstream dump) phase (upstream dump)
– – pilot bunches: ~ 5 10 pilot bunches: ~ 5 109
9
protons protons
Trigger: ≥ ≥ 10 hits on 10 hits on layer 2 layer 2
32 events triggered
– – Run 51403 (16:53 Run 51403 (16:53 to to 18:05 18:05) )
50 50
multiplicity
SPD
V0 vs vs SPD SPD
ADC vs multiplicity ∆t
51
52
st
52 52
first signals from ALICE
53
11 September, ~ 22:35 first capture – – beam 2 kept in orbit for over 10 minutes! beam 2 kept in orbit for over 10 minutes!
series of injections with tens of mins mins RF capture during night RF capture during night – – in ALICE: 673 events in total in ALICE: 673 events in total
first data for Physics (beam 2 background)
53 53
run 58338 run 58338 event 27 event 27
54
Trigger timing (before alignment) versus bunch number single shot for SPD, V0, beam-pickup BPTX, T0 triggers Auto-correlation for SPD trigger, with multi-turn correlations (3564 bunch crossings)
Beam pick-up T0 SPD V0
55
Mean pT vs multiplicity Multiplicity distribution
UA5:
43, 357 (1989) CDF:
D65,72005(2002)
Pseudorapidity density dN/dη
CDF:
D41, 2330 (1990)
pT spectrum unidentified hadrons
CDF:
51, 1819 (1988)
“First Papers” from previous energies; all required only small event samples (~20K events)
56
57
Nucl.Phys.A747:609-629(2005)
58
e diffractiv double e diffractiv single e diffractiv non elastic total − − −
insensitive ALICE trigger ND SD DD y y y dN/dy dN/dy dN/dy
59
and non-diffractive contributions.
processes has been studied – systematic error in measurement (S. Navin, C. Lazzeroni, R. Lietava)
PHOJET) for diffractive processes have been noted and are being investigated (M. Bombara, S. Navin, R. Lietava)
estimated from trigger ratios (Z.L. Matthews, O. Villalobos Baillie)
60
60
Systematics error = 4% Phojet and Pythia default fractions
Varying fractions to view effect of multiplicity change with respect to Pythia’s default multiplicities
and Phojet affect our efficiency of multiplicity measurements
fsd
MB1 trigger with Pythia as default
Sparsh Navin, IoP Nuclear Physics, 8th April 2009
S.Navin
61 61
NSD INEL SD DD
62
4 2 6 1 7 5 3 V0a V0c GFO
( )
( ) ( ) ( )
( )
( )
( )
1,3 2 2
8 4 1 5
calc ij i j calc measured trig
Ntrig a Type j Ntrig i Ntrig i Error Ntrig i Dof χ
=
= ⎛ ⎞ − = ⎜ ⎟ ⎜ ⎟ ⎝ ⎠ = − + =
∑ ∑
Tr V0A GFO V0C 1 1 2 1 3 1 1 4 1 5 1 1 6 1 1 7 1 1 1 Z.L. Matthews
( )
( )
( )
( )
1
DD SD ND NI trig trig trig trig trig DD SD ND NI trig rec DD trg SD trg ND trg NI trg DD SD ND NI rec DD trg SD trg ND trg DD SD ND trg
N = N + N + N + N N = N f ε + f ε + f ε + f ε = N f ε + f ε + f ε + f + f + f ε −
63
1972: KNO (statistical) scaling law ⇒ shape of distribution is independent of s
NPB 40, 317 (1972) ⎟ ⎟ ⎠ ⎞ ⎜ ⎜ ⎝ ⎛ Ψ = n n n 1 ) s ( Pn
Phojet Pythia
64
minimum bias pp events we will have statistics up to multiplicity ~150 – 10 times the average (30 events beyond)
trigger (with silicon pixel detector) – to enrich the high-multiplicity
in high-multiplicity pp events can reach that of a heavy-ion collision (according to the Bjorken formula), however, in much smaller volume
Claus Jorgensen
65
– Probability that a collision with the true multiplicity t is measured as an event with the multiplicity m – Created from full detector simulation (if needed: as function of vertex-z) – Mm = Rtm Tt Tt = Rtm
– Rtm can (usually) not be inverted (singular, statistic fluctuation)
|η| < 1.5, SPD tracklets number of tracklets number of primary particles Two approaches considered:
minimization
Method
66
Cut multiplicity in layer fired chips Fired chips vs. true multiplicity (in η
Sector: 4 (outer) + 2 (inner) staves H a l f
t a v e : 1 c h i p s SPD: 10 sectors (1200 chips)
Silicon pixel detector
OR signal from each pixel chip
400 chips layer 1; 800 layer 2
layer Few trigger thresholds
downscaling factors
determined by
event rate background double interactions
67
MB + 3 triggers 250 kHz coll. rate Bins < 5 entries removed
trigger rate Hz scaling raw rate threshol d layer 1 60.0 4167 250000
13.3 259 3453.3 114 13.3 16 213.3 145 13.3 1 13.3 165 Example of threshold tuning: MB and 3 high-mult. triggers 250 kHz collision rate recording rate 100 Hz MB 60% 3 HM triggers: 40%
J F Grosse-Oetringhaus
68
N events (log) Multiplicity
distribution
P(2)=0.16 P(3)=0.01 Z.L.Matthews
69
related to the energy density in the collision
Systematic Measurements of Identified Particle Spectra in pp, d+Au and Au+Au collisions from STAR arXiv:0808.2041v1 [nucl-ex] 14 Aug 2008
τ is formation time, S is overlapping area – Higher multiplicity reach at LHC pp, some events should exceed threshold energy density
QGP in pp at ALICE
70
fully commissioned detector & trigger alignment, calibration available from pp first 105 events: global event properties multiplicity, rapidity density elliptic flow first 106 events: source characteristics particle spectra, resonances differential flow analysis interferometry first 107 events: high-pt, heavy flavours jet quenching, heavy-flavour energy loss charmonium production yield bulk properties of created medium energy density, temperature, pressure heat capacity/entropy, viscosity, sound velocity, opacity susceptibilities, order of phase transition
early ion scheme 1/20 of nominal luminosity ∫Ldt = 5·1025 cm-2 s-1 x 10⁶ s 0.05 nb-1 for PbPb at 5.5 TeV Npp collisions = 2·108 collisions 400 Hz minimum-bias rate 20 Hz central (5%) muon triggers: ~ 100% efficiency, < 1kHz centrality triggers: bandwidth limited NPbPbminb = 107 events (10Hz) NPbPbcentral = 107 events (10Hz)
71
Secondary vertex and cascade finding Pb-Pb central
13 recons. Λ/event pT dependent cuts -> optimize efficiency over the whole pT range
Statistical limit : pT ~8 - 10 GeV for K+, K-, K0
s
, Λ, 3 - 6 GeV for Ξ, Ω
Λ
Ξ: 0.1/event Ω: 0.01/event pT : 1 to 3-6 GeV
300 Hijing events
8-10 GeV
7
106
72
300 central events 13 Λ/evt 107 events: pt reach φ,K,Λ ~ 13-15 GeV pt reach ρ,Ξ,Ω ~ 9-12 GeV
ρ0(770) π+π− 106 central Pb-Pb
Mass resolution ~ 2-3 MeV
φ (1020) K+K-
Mass resolution ~ 1.2 MeV
hadrochemical
analysis
chemical/kinetic
freeze-out
medium modifications of mass, widths
Thermal Freeze out
73
Eccentricity: Flow:
Φ – angle with respect to reaction plane R e a c t i
p l a n e X Z Y
74
answers from LHC
– Hydrodynamics: modest rise (Depending on EoS, viscosity, speed of sound) – experimental trend & scaling predicts large increase
BNL Press release, April 18, 2005:
RHIC Scientists Serve Up "Perfect" Liquid
New state of matter more remarkable than predicted – raising many new questions
L H C
75
d0 and pT distributions for “electrons” from different sources:
Beauty: semi-leptonic decays detection strategy
Distributions normalized to the same integral in order to compare their shapes
76
Semi-electronic Beauty detection simulation results
Expected statistics (107 Pb-Pb events)
Signal-to-total ratio and expected statistics in 107 Pb-Pb events
pT > 2 GeV/ c , 200 < | d0 | < 600 μm 90% purity 40,000 e from B
78
Extraction of a minimum-pT
cross section for B mesons
E loss calculations:
C.A. Salgado, U.A. Wiedemann, hep-ph/0501225
Using electrons in 2 < pT < 16 GeV/c
2 < pT
min
< 23 GeV/c stat pt
11% norm. err. (not shown)
79
pt (GeV) 2 20 100 200 100/event 1/event 103 in first 106 Pb-Pb events
Underlying event fluctuations Single particle spectra Correlation studies Event-by-event well distinguished objects Reconstructed jets 4 108 central PbPb collisions (month) 6 105 events
ALICE Acceptance
106 central PbPb collisions 1.5 103 events 106 central Pb-Pb events (pilot run)
80
50 GeV jet
η–φ lego plot with Δη 0.08 × Δφ 0.25
At large enough jet energy – jet clearly visible But still large fluctuation in underlying energy
Central Pb–Pb event (HIJING simulation) with 100 GeV di-jet (PYTHIA simulation)
100 GeV
81
Mean energy in a cone
from underlying event Fluctuation of energy from an underlying event in a cone of radius R
82
= out-of-cone fluctuations
Intrinsic resolution limit for ET = 100 GeV
For R < 0.3: ΔE/E = 16% from Background (conservative dN/dy = 5000) 14% from out-of-cone fluctuations
83
and charged particle identification
programme in pp provides a focus for the first
underway even before calibration of apparatus is complete.
collisions.
extensively for the first time. Allows use of perturbative methods to calculate yield in absence of partonic medium effects.
even at the highest Pb-Pb multiplicities (up to dN/dy ~8000), coupled with low material budget and precision vertexing, allows detection of close secondary vertices from heavy flavour.
jets.
84
algorithms satisfying SNOWMASS accords kt(FastJet) anti-kt(FastJet) SISCone
Soyez, JHEP 0804:005,2008
Event multiplicity Runtime [sec]
fluctuations from jet remnants
quenching needed
Wiedemann QM09