
SLIDE 1
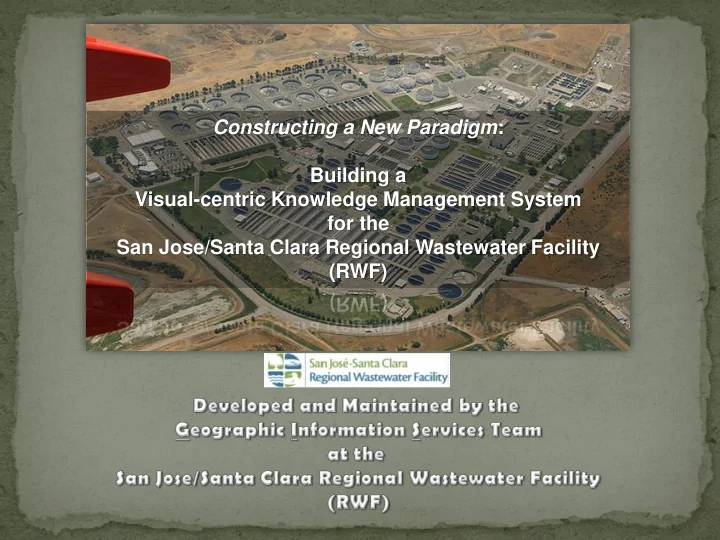
One Size Does Not Fit All: The Adventures of Building a GIS for the Inner Workings of a Sewage Treatment Plant Constructing a New Paradigm: Building a Visual-centric Knowledge Management System for the San Jose/Santa Clara Regional Wastewater Facility (RWF)