The Adoption of Network Goods Evidence from the Spread of Mobile - - PowerPoint PPT Presentation

the adoption of network goods evidence from the spread of
SMART_READER_LITE
LIVE PREVIEW

The Adoption of Network Goods Evidence from the Spread of Mobile - - PowerPoint PPT Presentation

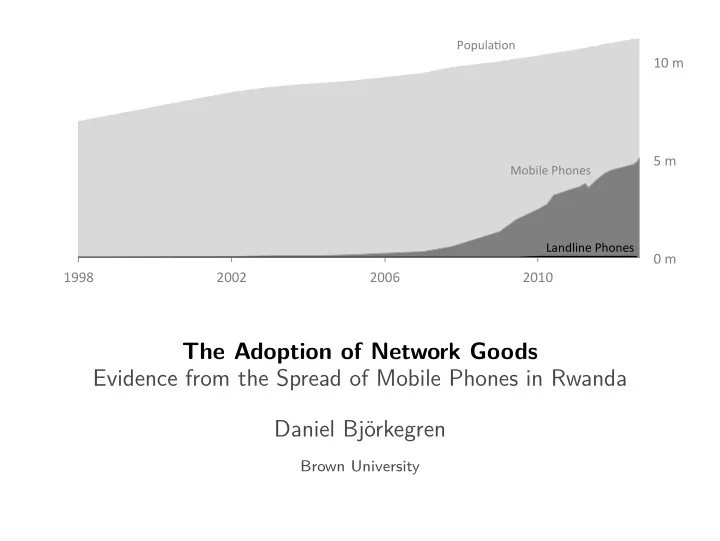
Popula'on 10 m 5 m Mobile Phones Landline Phones 0 m 1998 2002 2006 2010 The Adoption of Network Goods Evidence from the Spread of Mobile Phones in Rwanda Daniel


slide-1
SLIDE 1

Popula'on ¡ Mobile ¡Phones ¡ Landline ¡Phones ¡

0 ¡m ¡ 5 ¡m ¡ 10 ¡m ¡ 1998 ¡ 2002 ¡ 2006 ¡ 2010 ¡

The Adoption of Network Goods Evidence from the Spread of Mobile Phones in Rwanda Daniel Björkegren

Brown University

slide-2
SLIDE 2

Network Goods

  • Facebook, Yelp, Waze, NetFlix, ...
  • Mobile phones
  • Mobile internet
  • Mobile money
slide-3
SLIDE 3

Benefits from adopting a network good

slide-4
SLIDE 4

Benefits from adopting a network good

Contact

slide-5
SLIDE 5

Benefits accrue beyond adopter

Contact's Contact Contact

slide-6
SLIDE 6

Benefits accrue beyond adopter

slide-7
SLIDE 7

Firms may not fully internalize network effects

Competitive

Benefits of expansion may spill over into competitor's network

slide-8
SLIDE 8

Firms may not fully internalize network effects

Competitive Monopolistic

May underprovide if there are limits to price discrimination Benefits of expansion may spill over into competitor's network

slide-9
SLIDE 9

Achieving efficient adoption of network goods

Careful policies needed by both firms and governments

  • 1. Substantial theoretical work
  • Rohlfs 1974, Katz and Shapiro 1986, Farrell and Saloner 1985
  • 2. Little empirical work
  • Difficult to gather data on entire network
  • Difficult to identify network effects
  • Difficult to simulate effects of policies
slide-10
SLIDE 10

The Spread of Mobile Phones

Mobile phone subscriptions in developing economies: 250 million (2000)

Sources: ITU, GSMA

slide-11
SLIDE 11

The Spread of Mobile Phones

Mobile phone subscriptions in developing economies: 250 million (2000) → 4.5 billion (2011)

Sources: ITU, GSMA

slide-12
SLIDE 12

The Spread of Mobile Phones

Mobile phone subscriptions in developing economies: 250 million (2000) → 4.5 billion (2011) Estimate model of adoption and usage, as a function of social network, coverage, and prices

Sources: ITU, GSMA

slide-13
SLIDE 13

The Spread of Mobile Phones

Mobile phone subscriptions in developing economies: 250 million (2000) → 4.5 billion (2011) Estimate model of adoption and usage, as a function of social network, coverage, and prices Mobile: 7% of government revenues in sub-Saharan Africa

Sources: ITU, GSMA

slide-14
SLIDE 14

The Spread of Mobile Phones

Mobile phone subscriptions in developing economies: 250 million (2000) → 4.5 billion (2011) Estimate model of adoption and usage, as a function of social network, coverage, and prices Mobile: 7% of government revenues in sub-Saharan Africa Simulate:

  • 1. Government requirement to serve rural areas
  • 2. Alternate tax policies

Sources: ITU, GSMA

slide-15
SLIDE 15

Context Method Model Rural Coverage Taxation

The Spread of Mobile Phones in Rwanda

Mobile ¡Phones ¡ This ¡study ¡

Landline ¡Phones ¡ 0 ¡m ¡ 1 ¡m ¡ 2 ¡m ¡

1998 ¡ 2002 ¡ 2006 ¡ 2010 ¡

slide-16
SLIDE 16

Context Method Model Rural Coverage Taxation

The Spread of Mobile Phones in Rwanda

Mobile ¡Phones ¡ This ¡study ¡

Landline ¡Phones ¡ 0 ¡m ¡ 1 ¡m ¡ 2 ¡m ¡

1998 ¡ 2002 ¡ 2006 ¡ 2010 ¡

  • Handset prices $70 (2005) → $20 (2009)
slide-17
SLIDE 17

Context Method Model Rural Coverage Taxation

The Spread of Mobile Phones in Rwanda

Mobile ¡Phones ¡ This ¡study ¡

Landline ¡Phones ¡ 0 ¡m ¡ 1 ¡m ¡ 2 ¡m ¡

1998 ¡ 2002 ¡ 2006 ¡ 2010 ¡

  • Handset prices $70 (2005) → $20 (2009)
  • Operators adapted to reach poorer consumers:
  • Coverage expanded: 60% → 95% of country
  • Calling prices reduced by over 50%

Sources: RURA

slide-18
SLIDE 18

Context Method Model Rural Coverage Taxation

Data

Call Detail Records - with Nathan Eagle (Jana Inc.) Anonymous transaction records from dominant operator, 2005-2009 Transaction Amount ID.From ID.To Tower Timestamp Call Call attempt SMS IDs map to account and handset for sender and recipient. No other characteristics on subscribers. 5.3 billion transactions

slide-19
SLIDE 19

Context Method Model Rural Coverage Taxation

slide-20
SLIDE 20

Context Method Model Rural Coverage Taxation

slide-21
SLIDE 21

Context Method Model Rural Coverage Taxation

slide-22
SLIDE 22

Context Method Model Rural Coverage Taxation

Nearly all remote communication in Rwanda: 88% of mobile phones Insignificant landline network

slide-23
SLIDE 23

Context Method Model Rural Coverage Taxation

Duration

slide-24
SLIDE 24

Context Method Model Rural Coverage Taxation

Duration at high price ΔDuration ΔPrice

slide-25
SLIDE 25

Context Method Model Rural Coverage Taxation

Duration at low price ΔDuration ΔPrice

slide-26
SLIDE 26

Context Method Model Rural Coverage Taxation

$4 $3 $3 $2 $2 $1

How much value do people get from communicating?

slide-27
SLIDE 27

Context Method Model Rural Coverage Taxation

$ $ $ $ $ $

Adoption Decision Consider: Handset price Network benefits

slide-28
SLIDE 28

Context Method Model Rural Coverage Taxation

Equilibrium Adoption Under different policy

slide-29
SLIDE 29

Context Method Model Rural Coverage Taxation

Model

ij

U (p )

i

(p , coverage , coverage ) Adoption Decision Call Decision

handset t t it jt

Eu

slide-30
SLIDE 30

Context Method Model Rural Coverage Taxation

Model

U (p )

i

Adoption Decision Call Decision

handset t

Within-link changes in price and coverage Identification: Geographical and policy instruments

Euij(p , coverage , coverage )

t it jt

slide-31
SLIDE 31

Context Method Model Rural Coverage Taxation

Adoption Equilibrium

Compute new equilibrium based on change to the environment.

slide-32
SLIDE 32

Context Method Model Rural Coverage Taxation

Adoption Equilibrium

Compute new equilibrium based on change to the environment. Equilibrium Γ(η): function of individuals’ unobserved benefits ηi Each i adopts at τi = arg maxt Ut

i (ηi, ˆ

τ Gi)

slide-33
SLIDE 33

Context Method Model Rural Coverage Taxation

Multiple Equilibria

Obtain a set of equilibria Γ (η) due to uncertainty in η and coordination.

slide-34
SLIDE 34

Context Method Model Rural Coverage Taxation

Multiple Equilibria

Obtain a set of equilibria Γ (η) due to uncertainty in η and coordination. Game has strategic complements; equilibria form a lattice. Individual bounds [ηi, ¯ ηi] and bounds on expectations ˆ τ j ∈

  • 0, ¯

T

  • imply bounds on set of equilibria:

Γ (η) ≤ Γ (η) ≤ ¯ Γ (¯ η)

(Topkis 1978, Milgrom and Shannon 1994)

slide-35
SLIDE 35

Context Method Model Rural Coverage Taxation

Simulation Fit

500,000 1,000,000 1,500,000 2005 2006 2007 2008 2009

Date Subscribers

Data Simulation: Mean Simulation: Bounds

(Bounds result from uncertainty in ηi and the span of equilibria.)

slide-36
SLIDE 36

Context Method Model Rural Coverage Taxation

Cost of expanding towers

$

Number of Towers

  • m. Cost
slide-37
SLIDE 37

Context Method Model Rural Coverage Taxation

Optimal coverage

$

  • m. Cost
  • m. Welfare

Tsocial

*

Number of Towers

slide-38
SLIDE 38

Context Method Model Rural Coverage Taxation

Private returns from coverage may differ from social returns

$

  • m. Cost
  • m. Revenue
  • m. Welfare

T

private *

Tsocial

*

May not fully internalize network effects May face limits on price discrimination Number of Towers

slide-39
SLIDE 39

Context Method Model Rural Coverage Taxation

Coverage obligation

$

  • m. Cost
  • m. Revenue
  • m. Welfare

T

private *

Tsocial

*

Number of Towers

slide-40
SLIDE 40

Context Method Model Rural Coverage Taxation

Effect of policy depends on shape of welfare and revenue

$

  • m. Cost
  • m. Revenue
  • m. Welfare

Number of Towers

slide-41
SLIDE 41

Context Method Model Rural Coverage Taxation

Peel back tower construction (based on realized revenue)

5 10 15 20 10 20 30 Rural Urban $0 $50,000 $100,000 $150,000 $200,000

Direct Baseline Revenue (Average Monthly) Towers

Lowest 6% 6−12%

  • Don’t build the lowest revenue rural towers (6%)
  • Save $496,660 in annualized build and operation costs
slide-42
SLIDE 42

Context Method Model Rural Coverage Taxation

Effect of Rolling Out Rural Coverage

Lowest 6% 6−12% 1,000,000 2,000,000 3,000,000 Benefits Cost Benefits Cost

USD

Consumer Surplus Government Revenue Revenue Tower Cost

Benefits dispersed: much of consumer surplus to individuals whose coverage was unaffected

slide-43
SLIDE 43

Context Method Model Rural Coverage Taxation

How, and how much to tax?

66% of government revenue from mobile from consumer taxes on handsets and usage. Average tax rate in SSA (2007): 31% handsets, 20% airtime

slide-44
SLIDE 44

Context Method Model Rural Coverage Taxation

How, and how much to tax?

66% of government revenue from mobile from consumer taxes on handsets and usage. Average tax rate in SSA (2007): 31% handsets, 20% airtime Simulate alternative tax policies

slide-45
SLIDE 45

Context Method Model Rural Coverage Taxation

Taxation

Tax Revenue ($m) Consumer Handset Telecom Government Surplus ($m)

Baseline: 48% [193, 210] [78, 84] [37, 44] 48% until 2007, then 0% [205, 217] [67, 70] [60, 62] 48% until 2006, then 0% [207, 217] [66, 69] [63, 67] 0% [208, 220] [62, 65] [65, 66]

slide-46
SLIDE 46

Context Method Model Rural Coverage Taxation

Taxation

Tax Revenue ($m) Consumer Handset Telecom Government Surplus ($m)

Baseline: 48% [193, 210] [78, 84] [37, 44] 48% until 2007, then 0% [205, 217] [67, 70] [60, 62] 48% until 2006, then 0% [207, 217] [66, 69] [63, 67] 0% [208, 220] [62, 65] [65, 66]

  • When network effects are ignored, underestimate tax distortions (by up to

45% on firm revenue)

  • Welfare cost of $2.56 or $1.62 per government dollar (vs. MCF in

sub-Saharan Africa 1.21 (1.37 Rwanda), Auriol and Warlters 2012)

slide-47
SLIDE 47

Context Method Model Rural Coverage Taxation

Taxation

Tax Revenue ($m) Consumer Handset Airtime Telecom Government Surplus ($m) Baseline: 48% 23% [193, 211] [78, 84] [37, 44] ...above Q90 usage [114, 122] [35, 38] [28, 32] ...below Q90 usage [79, 89] [43, 47] [9, 12]

slide-48
SLIDE 48

Context Method Model Rural Coverage Taxation

Taxation

Tax Revenue ($m) Consumer Handset Airtime Telecom Government Surplus ($m) Baseline: 48% 23% [193, 211] [78, 84] [37, 44] ...above Q90 usage [114, 122] [35, 38] [28, 32] ...below Q90 usage [79, 89] [43, 47] [9, 12] 48% until 2006, then 0% 23% [207, 217] [66, 69] [63, 67] ...above Q90 usage [119, 124] [36, 37] [33, 35] ...below Q90 usage [88, 93] [30, 32] [30, 31]

slide-49
SLIDE 49

Context Method Model Rural Coverage Taxation

Taxation

Tax Revenue ($m) Consumer Handset Airtime Telecom Government Surplus ($m) Baseline: 48% 23% [193, 211] [78, 84] [37, 44] ...above Q90 usage [114, 122] [35, 38] [28, 32] ...below Q90 usage [79, 89] [43, 47] [9, 12] 48% until 2006, then 0% 23% [207, 217] [66, 69] [63, 67] ...above Q90 usage [119, 124] [36, 37] [33, 35] ...below Q90 usage [88, 93] [30, 32] [30, 31] 48% until 2006, then 0% 30% [181, 193] [82, 87] [52, 58] ...above Q90 usage [105, 110] [46, 48] [29, 32] ...below Q90 usage [76, 83] [36, 39] [23, 27]

Q90 usage ≈ 1.6 minutes/day. Shifting from adoption to usage taxes would dramatically increase consumer surplus accruing to 90% of users

slide-50
SLIDE 50

Context Method Model Rural Coverage Taxation

The Spread of Mobile Phones

Method to estimate and simulate adoption of a network good Use data from nearly the entire Rwandan cell phone network:

  • Estimate structural model of adoption

as a function of each individual’s social network, coverage, and prices

  • Simulate policies

Government requirement to serve rural consumers: improved welfare Alternate tax policies Paper: Adoption subsidies: high return, large fraction of effect due to spillovers