
SLIDE 1
1
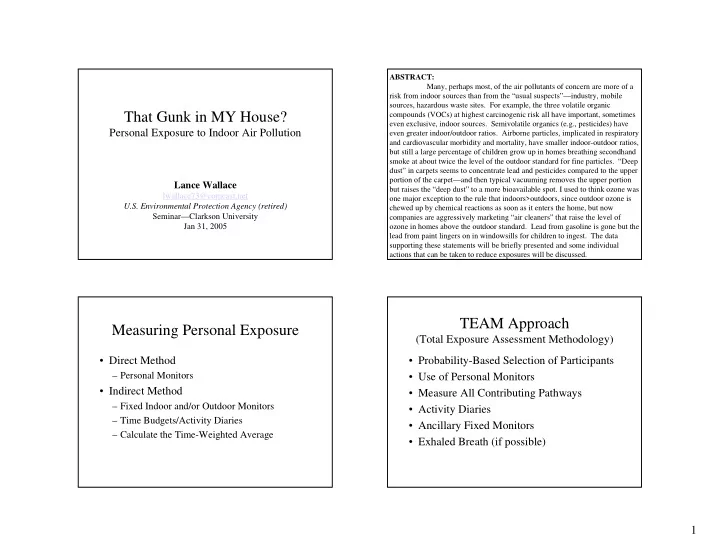
That Gunk in MY House?
Personal Exposure to Indoor Air Pollution
Lance Wallace
lwallace73@comcast.net U.S. Environmental Protection Agency (retired) Seminar—Clarkson University Jan 31, 2005
ABSTRACT: Many, perhaps most, of the air pollutants of concern are more of a risk from indoor sources than from the “usual suspects”—industry, mobile sources, hazardous waste sites. For example, the three volatile organic compounds (VOCs) at highest carcinogenic risk all have important, sometimes even exclusive, indoor sources. Semivolatile organics (e.g., pesticides) have even greater indoor/outdoor ratios. Airborne particles, implicated in respiratory and cardiovascular morbidity and mortality, have smaller indoor-outdoor ratios, but still a large percentage of children grow up in homes breathing secondhand smoke at about twice the level of the outdoor standard for fine particles. “Deep dust” in carpets seems to concentrate lead and pesticides compared to the upper portion of the carpet—and then typical vacuuming removes the upper portion but raises the “deep dust” to a more bioavailable spot. I used to think ozone was
- ne major exception to the rule that indoors>outdoors, since outdoor ozone is
chewed up by chemical reactions as soon as it enters the home, but now companies are aggressively marketing “air cleaners” that raise the level of
- zone in homes above the outdoor standard. Lead from gasoline is gone but the
lead from paint lingers on in windowsills for children to ingest. The data supporting these statements will be briefly presented and some individual actions that can be taken to reduce exposures will be discussed.
Measuring Personal Exposure
- Direct Method
– Personal Monitors
- Indirect Method
– Fixed Indoor and/or Outdoor Monitors – Time Budgets/Activity Diaries – Calculate the Time-Weighted Average
TEAM Approach
(Total Exposure Assessment Methodology)
- Probability-Based Selection of Participants
- Use of Personal Monitors
- Measure All Contributing Pathways
- Activity Diaries
- Ancillary Fixed Monitors
- Exhaled Breath (if possible)