Texas As Assoc ociation of Ru Rural Schoo ools Working for - - PowerPoint PPT Presentation

texas as assoc ociation of ru rural schoo ools
SMART_READER_LITE
LIVE PREVIEW

Texas As Assoc ociation of Ru Rural Schoo ools Working for - - PowerPoint PPT Presentation

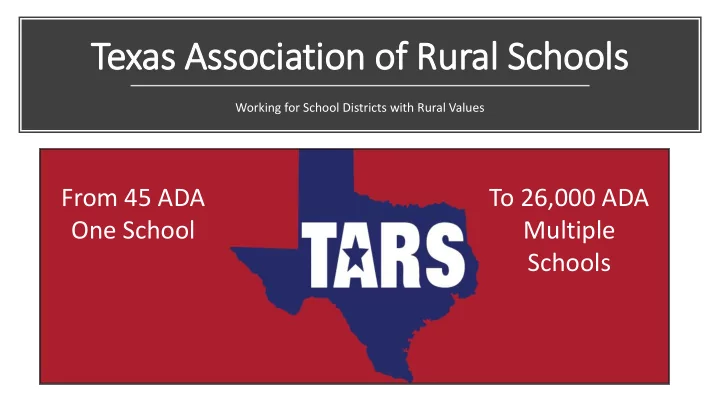
Texas As Assoc ociation of Ru Rural Schoo ools Working for School Districts with Rural Values From 45 ADA To 26,000 ADA One School Multiple Schools How to Conta ntact us! w www.ta tarsed.org rg Michael Lee tarsed@centex.net


slide-1
SLIDE 1

Texas As Assoc

  • ciation of Ru

Rural Schoo

  • ols

Working for School Districts with Rural Values

From 45 ADA One School To 26,000 ADA Multiple Schools

slide-2
SLIDE 2

How to Conta ntact us! w www.ta tarsed.org rg

slide-3
SLIDE 3

Michael Lee

tarsed@centex.net 806/202-2764

Leigh Ann Glaze

tars@centex.net 325/372-8552 301 East Wallace Street PO Box 503 San Saba, Texas 76877 Retired Booker ISD 2012 Past Region 16 Board of Directors Former School Board Member Interim Superintendent Rancher/Farmer Retired San Saba ISD 2017 Registrar/Veterans Liaison Howard Payne University Region 15 Board of Directors

slide-4
SLIDE 4
  • D. John Hubbard

Ian Randolph

301 East Wallace Street PO Box 503 San Saba, Texas 76877

Legislative Contacts in Austin serving you daily

slide-5
SLIDE 5

The he Pur urpose se of TARS i is Twofold:

  • 1. To impact the state's school finance and property tax

systems so to ensure equitable distribution of education resources and tax burdens, and

  • 2. To become involved both directly and indirectly in the

policy- making and administrative processes of federal, state, and local entities (excluding school districts) by:

  • a. Monitoring the entities,
  • b. Conducting the independent research, and
  • c. Making specific recommendations.
slide-6
SLIDE 6
slide-7
SLIDE 7

TARS Of Office cers

  • President

Rebecca McCutchen, Alpine ISD

  • President Elect

Aaron Hood, Robert Lee ISD

  • Vice-President

Greg Gilbert, Santo ISD

  • Secretary

Tommy Hooker, Thrall ISD

  • Treasurer

Joe Lopez, Taft ISD

  • Past President

Robert Dillard, Littlefield ISD

slide-8
SLIDE 8

TARS S Region

  • nal Direc

ector

  • rs
  • Region 1

Albert Pena San Perlita ISD

  • Region 2

Michelle Hartman Pawnee ISD

  • Region 3

Jon Wunderlich Weimar ISD

  • Region 4

Marc Keith Tarkington ISD

  • Region 5

Jim Armstrong West Hardin County CISD

  • Region 6

John Kaufman Trinity ISD

  • Region 7

Brian Gray White Oak ISD

  • Region 8

John Booth DeKalb ISD

  • Region 9

Casey Adams Woodson ISD

  • Region 10

James Sanders Scurry Rosser ISD

slide-9
SLIDE 9

Regi gion

  • nal D

Direc ector

  • rs
  • Region 11

William Stokes Valley View ISD

  • Region 12

Chris Heskett Covington ISD

  • Region 13

Paul Michalewicz Florence ISD

  • Region 14

Gary Speegle Comanche ISD

  • Region 15

Russell Dacy Wall ISD

  • Region 16

Blair Brown Panhandle ISD

  • Region 17

Dane Kerns Smyer ISD

  • Region 18

Debbie Engle Valentine ISD

  • Region 19

Evelyn Loeffler Sierra Blanca ISD

  • Region 20

Jessica Milam Utopia ISD

slide-10
SLIDE 10

Regi gion

  • nal D

Direc ector

  • rs
  • At-Large 6

Eric Carpenter Big Sandy ISD

  • At-Large 10

Jon Hill Dodd City ISD

  • At-Large 14

Todd Burleson West Brook ISD

  • At-Large 16

Clay Montgomery Spearman ISD

  • At Large 18

Scott Carman Wink-Loving ISD

slide-11
SLIDE 11

Le Legislati tive Ef Efforts

  • Worked with Governor’s office on school safety.
  • Worked with Governor’s office on broadband internet.
  • Worked with the Education Superhighway on the Governor’s

Connectivity Initiative

  • Presented at Hispanic Caucus in Odessa Texas.
  • Attended and represented schools at West Texas Forum hosted by

Congressman Arrington in Lubbock.

  • Attended meetings and prepared witnesses for the Commission on

Public School Finance meetings.

  • Work with all organizations to maximize efforts for public schools.
  • Focused very narrowly on Small/Mid-size school adjustment. Also

worked on selected bills to support or possibly help prevent from becoming law (Sp. Ed. Bill)/Financial Literacy

  • Prepared witnesses to testify on the Readability of STAAR Test.
  • Provided data and research to legislative offices

regarding school finance and career and technology programming.

  • Worked with education partners – Common Ground Group – to

identify common goals and objectives for educational community.

  • Partner with Texas Educators Vote
slide-12
SLIDE 12

86 86th

th Le

Legislature Highlights ts

  • Funding for School Districts ($6. 5 Increase; BA $6,160)
  • FY20 Rural Districts Increased $1,223 per ADA Above Current Law;

Charters $705 per ADA; Major Urban $550 per ADA.

  • FY21 Rural Districts Increased $1,116 per ADA Above Current Law;

Charters $885 per ADA; Major Urban $620 per ADA.

  • Improved transportation funding, added Dyslexia Education into Sp.

Ed., kept Special Education at front of small/mid-size school adjustment, Small/mid-size adjustment for school districts that are

  • nly district in county.
  • Retired teachers receiving a 13th check.
  • TRS considered “Actuarily Sound.”
slide-13
SLIDE 13

86 86th

th Le

Legislature (Lo Losses)

  • Lost Small/Mid-size School Adjustment for CTE,

Bilingual, Comp. Ed, GT (GT rolled into Basic Allotment).

  • Public Education is based on a good economy. When

economy struggles where will we be (2011????).

  • TRS considered “Actuarily Sound.” What determines

“Actuarily Sound?” The increase in contributions comes on the backs of active employees and school districts. Active employees are and will pay a higher percentage than those who are already retired.

  • Local control continues to be eroded?
slide-14
SLIDE 14

CTE E Un Uninten ended ed Conseq equen ence!!

School Districts with approximately 800 ADA and below actually lose money by adding FTEs into their CTE Programs. The further away from 1,600 ADA, the worse the issue. The smaller School Districts might generate more money without “zero” FTEs in CTE than with what they are showing.

We would like to thank Mr. Johnny Zolman, School Finance Consultant and

  • thers, for analyzing and offering a solution to this issue and/or problem as
  • utlined below.

Problem

The FTE’s for CTE programs are subtracted from both the Regular School Allotment and the Small School Allotment. They are added back in only once through the CTE Allotment, which creates a discrepancy for school districts below 800 ADA. The smaller the ADA, the larger the discrepancy. (The further away from 1,600 ADA the larger the discrepancy for the district).

Solution

Add the FTE’s for the CTE programs back into the Small School Allotments. This would provide the gains that should be received for the school districts affected. (This solution should benefit all school districts below 5,000 ADA).

slide-15
SLIDE 15

CTE E Un Uninten ended ed Conseq equen ence!!

  • 9/4/2019 Received information concerning this issue

Region 8 RAC-Rick Flanagan, Field Agent.

  • Confirmed with follow up phone call Mr. Zolman: Region

6: Contacted TEA, unsure of ability to address issue.

  • 9/12/2019 Sent letter to superintendents alerting them

to possible problems: Modified template from De Kalb ISD so superintendents could plug in numbers.

  • 9/18/2019 TARS sent email to Commissioner Morath

asking him to investigate situation.

  • 9/23/2019 Visited with other organizations at Fall

TASB/TASA Convention. Led to meeting to organize efforts.

  • 9/26/2019 Representative Ashby Letter, et al. 20

Legislators, 10 Organizations.

slide-16
SLIDE 16

CTE E Un Uninten ended ed Conseq equen ence!!

  • 10/04/2019 Morath Response to TARS: Acknowledged problem,

encouraged schools to look at total income, contact Leo Lopez with further questions.

  • 10/18/2019 Phone conference with Leo Lopez: Said TEA was

running numbers on issue. Expected to give response late November, early December.

  • 10/28/2019 Helped prepare testimony to House Education

Committee for Marshall Harrison, Sunray. Positive comments from House Education Committee.

  • 11-04/2019 Helped TARS Director Albert Pena prepare information

for Roundtable Discussion with Lt. Gov. Dan Patrick and Senator Lucio, V. Chair of Senate Education Committee highlighting CTE.

  • 11/20/2019 Morath second response, said TEA is looking into both

short-term and long-term solutions.

  • 11/20/2019 Indication that the CTE issue would be on December’s

list of unintended consequences to both LBB and Governor’s office.

  • 12/3/2019

Leo Lopez has meeting with Morath 12/6/19?

  • 12/13/2019 TEA still working through issue.
slide-17
SLIDE 17

CTE E Un Uninten ended ed Conseq equen ence!!

  • House Education Committee Testimony
  • 19-10-28 Testimoney House Education Committee.pdf
slide-18
SLIDE 18

Sunray ISD- ADA 517. 517.98

SCENERIO 1 SCENERIO 2 DIFFERENCE SC 2 - SC 1

REFINED ADA

517.98 517.98

CTE FTE'S

37.119 53.137 16.02

REGULAR PROGRAM ADA (2)

466.87 450.85 (16.02)

REGULAR PROGRAM ALLOTMENT (21)

$2,875,901.00 $2,777,230.00 ($98,671.00)

SMALL/MID-SIZE ALLOTMENT (22)

$1,303,511.00 $1,276,583.00 ($26,928.00)

TOTAL SPECIAL EDUCATION ADJUSTED ALLOTMENT (23)

$625,678.00 $628,450.00 $2,772.00

CAREER & TECH ALLOTMENT (27)

$309,282.00 $442,487.00 $133,205.00

TOTAL COST OF TIER 1 (42)

$5,623,231.00 $5,633,608.00 $10,377.00

FSP STATE SHARE OF TIER 1 (45)

$2,983,545.00 $2,993,922.00 $10,377.00

TIER 2 STATE AID (46)

$236,999.00 $237,628.00 $629.00

TOTAL FSP OPERATING FUND (48)

$3,340,544.00 $3,351,550.00 $11,006.00

FOUNDATION SCHOOL PROGRAM (49)

$3,340,544.00 $3,351,550.00 $11,006.00

TOTAL FSP/ASF (55)

$3,488,078.00 $3,499,084.00 $11,006.00

NET M&O REVENUE LOCAL TAXES (62)

$5,949,458.00 $5,960,464.00 $11,006.00

TOTAL M&O REVENUE FROM STATE (64)

$5,949,458.00 $5,960,464.00 $11,006.00

DIFFERENCE IN REV.

$11,006 Sunray ISD should have received a gain of $34,534.00 (Revenue for CTE – Revenue for Regular Program Funding). Instead a net revenue of only $11,006.00 is realized for a loss of $23,528.00.

slide-19
SLIDE 19

Coving ngton n ISD – ADA 271. 271.81 81

SCENERIO 1 SCENERIO 2 DIFFERENCE SC 2 - SC 1 REFINED ADA 271.81 271.81 CTE FTE'S 21.392 30.07 8.68 REGULAR PROGRAM ADA (2) 242.65 233.98 (8.68) REGULAR PROGRAM ALLOTMENT (21) $1,494,749.00 $1,441,292.00 ($53,457.00) SMALL/MID-SIZE ALLOTMENT (22) $811,556.00 $787,536.00 ($24,020.00) TOTAL SPECIAL EDUCATION ADJUSTED ALLOTMENT (23) $379,486.00 $380,340.00 $854.00 CAREER & TECH ALLOTMENT (27) $177,896.00 $250,062.00 $72,166.00 TOTAL COST OF TIER 1 (42) $3,296,598.00 $3,292,141.00 ($4,457.00) FSP STATE SHARE OF TIER 1 (45) $2,252,734.00 $2,248,276.00 ($4,458.00) TIER 2 STATE AID (46) $381,750.00 $381,033.00 ($717.00) TOTAL FSP OPERATING FUND (48) $2,634,484.00 $2,629,309.00 ($5,175.00) FOUNDATION SCHOOL PROGRAM (49) $2,634,484.00 $2,629,309.00 ($5,175.00) TOTAL FSP/ASF (55) $2,710,104.00 $2,704,930.00 ($5,174.00) NET M&O REVENUE LOCAL TAXES (62) $3,734,627.00 $3,729,453.00 ($5,174.00) TOTAL M&O REVENUE FROM STATE (64) $3,734,627.00 $3,729,453.00 ($5,174.00) DIFFERENCE IN REV. ($5,174)

Covington ISD should have received an increase in overall funding of $18,709.00 pursuant to adding 8.68 FTE’s in CTE programs. The net effect is a loss of ($5,174.00) for a total loss in funding of $23,883.00. CISD would show a gain of $16,088 with zero FTEs for CTE program.

slide-20
SLIDE 20

CTE Sample School Districts

FY20 EXAMPLE CTE IMPACT SMALL-MIDSIZE.xlsx

slide-21
SLIDE 21

Provided d data and r research t to legislative o

  • ffi

ffices regarding school f finance ce/ career a and t technology programming.

  • Worked with Representative Lambert’s office during the session. Asked our opinion
  • f working on a bill to have TEA do a study on feasibility of school districts working

toward summer programs for CTE and the districts earning funding for the summer FTEs.

  • TARS recommended that instead of a study, implement pilot programs in each Region of

the State.

  • Will eventually lead to adding FTEs from summer programs into the CTE funding for the

Fiscal Year

  • Result: Grant for CTE Summer Collaboratives.

Application is currently open: Due - 5:00 p.m. Central Time, January 7, 2020

slide-22
SLIDE 22

Gr Grant f for C CTE S Sum ummer er Collaboratives. es.

Career and Technical Education Courses (Focus Area 1):

  • Eligible applicants must offer Career and Technical Education

courses aligned to or preparing students for statewide programs

  • f study. Recommended summer programs may include:
  • Implementing a CTE summer bridge program for incoming 9th

graders

  • Implementing a CTE summer bridge program for students

continuing from high school into a postsecondary program o Example: High school student earns Certified Nursing Assistant certification (CNA) and completes a postsecondary bridge program over the summer for a licensed vocational nurse program

  • Partnering with local districts to offer CTE courses during summer

months through shared use agreements

  • Acceleration programs designed to help students complete

advanced courses in a CTE program of study LEAs, ESCs, and Institutions of Higher Education may serve as fiscal agents for the grant.

slide-23
SLIDE 23

Gr Grant f for C CTE S Sum ummer er Collaboratives. es.

Work-Based Learning Experiences (Focus Area 2):

  • Eligible applicants must create and/or expand work-based

learning experiences for students. Applicants must facilitate and monitor work-based learning experiences. These activities must correlate to earned credit via a work-based learning related course such as Career Preparation or CTE Practicum courses. Recommended summer programs may include:

  • Internship programs with local employers
  • Pre-apprenticeship and/or youth apprenticeship training

programs

  • Project-based learning where students complete a project of

value to a local business through Career Preparation or CTE Practicum courses LEAs and ESCs may serve as the fiscal agent for the grant

slide-24
SLIDE 24

86th

th Legi

gislature C CTE E E Enhancements

Conduct a Study on Alternative Career Readiness Measures for Small and Rural Districts

  • Due January 2021, the study requires TEA to look at alternative career

readiness measures for small and rural districts to determine if annual graduates demonstrate career readiness under A-F

slide-25
SLIDE 25

86th

th Legi

gislature C CTE E E Enhancements

Improving College, Career, and Military Readiness Requires Boards of Trustees to develop and post CCMR plans that set specific annual goals (2.003, 2.035) Establishes a CCMR Outcomes Bonus with funding paid for each annual graduate above a certain threshold percentage. (1.031) The amounts and likely threshold percentages are:

  • Educationally disadvantaged - $5,000 each above the first 13% of CCMR

graduates

  • Non-educationally disadvantaged - $3,000 each above the first 25% of CCMR

graduates

  • Special Education - $2,000 for each CCMR graduate
  • Commissioner shall conduct a study on alternative career readiness measures

for small and rural districts for the bonus (1.031)

slide-26
SLIDE 26

86th

th Legi

gislature C CTE E E Enhancements

Reimburses districts to ensure students are given at least one college preparation assessment (TSIA, SAT, ACT) and at least one industry certification exam by graduation (1.035, 1.036, 2.031; 2.034) Expands CTE funding from grades 9-12 to grades 7-12 and adds technology application courses (like computer science) for funding (1.030) Districts receive an extra $50 per student in P-TECH and New Tech High School models (1.030) Requires completion of a FAFSA prior to graduation (2.014, 2.015) 2021–2022 School Year (From Commission on Public Education Funding)

  • Allows for a parental, counselor or self (over 18) opt out (2.015)
  • Commissioner must establish an advisory committee (2.015)
slide-27
SLIDE 27

CTE i E issues f for t the 87th L Legi gislature

  • Did TEA Meet or Exceed This Solution:

Add the FTE’s for the CTE programs back into the Small School Allotments. This would provide the gains that should be received for the school districts affected. (This solution should benefit all school districts below 5,000 ADA: Agreed with Zolman/confirmed with Karr).

  • Work toward Small/Mid-size Adjustment

Continue work toward the small/mid-size adjustment for CTE/Compensatory Ed/Bilingual

slide-28
SLIDE 28

Issu sues es for 87t 87th L Legisl slature

  • Fully Fund HB-3 (what happens when basic

allotment decreases?)

  • Consolidation
  • Financial Literacy Requirements
  • Prohibiting School Districts to Join

Organizations Such As TARS

slide-29
SLIDE 29

TARS T Top Four L Legisl slative Go Goals

  • Plan for sustained state funding through

Basic Allotment

  • Re-establish small/midsize school

adjustment

  • Work AGAINST consolidation of districts

and/or consolidation of superintendents

  • DOI—You need to educate Legislators

about DOI and why you need it! (viewed as way to start school early)

slide-30
SLIDE 30

Financ ncial Litera racy

  • We want to find schools willing to

pilot a program on Financial Literacy.

  • We have a great start in Whiz Bizz
  • Kids. They have excellent results

through camps. Now we need to find ways to implement in classrooms targeting 3-8 grades. (video)

  • Also provide financial literacy for

educators if desired by school districts through meetings or staff development.

slide-31
SLIDE 31

What About Your ur F Financial Literacy? acy?

  • What changes in law have occurred for 403b Programs? (HB 2820)
  • What is your responsibility as Superintendent to oversee salary

reduction program?

  • What about your and employee’s savings program? Will it be

adequate to fill in the gap between retirement and current salary?

  • Will you and your employees pay more taxes in retirement, or

increase income without increasing taxes?

  • Can a District meet HB-3 requirements through a 401 A program?
slide-32
SLIDE 32
slide-33
SLIDE 33

HB 2820

  • TRS no longer approves companies or oversees /approves products for 403b
  • Approved list is available for one year. Any insurance company /securities

company meeting requirements can be used by educators.

  • Cap on fees is lifted, so educators need to ask cost of fees.
  • If you let one vendor in to make sales, must open district to all vendors.
  • Can a District meet HB 3 salary requirements through a 401 A program?

Probably/Possibly

  • Most teachers will invest less in a 403b than what can be invested in a Roth

IRA (so encourage Roth IRA or other investments).

  • Gives educators more flexibility.
slide-34
SLIDE 34

HB 2820—Possible Ramifications

  • Make agents are properly licensed and insured with errors and omissions

insurance.

  • The more licenses an agent has the more they can offer your employees.

Must have security licenses to offer variable products.

  • Make sure you and Board of Trustees are properly insured.
  • Review policy and make necessary updates if any.
  • Most of the responsibility should go on employee using this program.
slide-35
SLIDE 35

403b

  • Educate your employees about Partial Lump Sums---Think long and hard

before doing so, as most do not work out well!

  • (Did you know that your 403b program can have Roth Options?

You can make the change with a simple phone call to Third Party Administrator!!)

slide-36
SLIDE 36

Joint Retirement Income

$100,000 Income $24,400 Standard Deduction $75,600 X 22% $16,632 Total Taxes Paid $83,368 Income After Taxes

Tax Exempt Retirement Income

$155,000 No Added Tax $138,368 Total Income

PAY TAXES ON SEED, SAVE TAXES ON CROP

SAVE TAXES ON SEED, PAY TAXES ON THE CROP

Tax Shelter Income Added to Total Retirement Income Joint Retirement Income

$155,000 Added Tax $130,600 x 22% = $28,732 $126,268 Annual Income

$100,000 Income $24,400 Standard Deduction $75,600 X 22% $16,632 Total Taxes Paid $83,368 Income After Taxes

(2019) $12,100 per year increase in take home income with a tax-exempt investment

slide-37
SLIDE 37

Legislative Changes to TRS for Active Members 2013-2015-2017-2019

FY 13 Contribution FY 14 Starts

9/1/13

FY 15* FY 16 FY 17** FY 20** FY 21** FY 22** FY 23** FY 24** FY 25** Texas 6.4% 6.8% 6.8% 6.8% 6.8% 7.5% 7.5% 7.75% 8.00% 8.25% 8.25% Schools

6.4% above state minimum salary times CEI 6.4% above state minimum salary times CEI 1.5% of state minimum + 6.4% 1.5% of state minimum + 6.4% 1.5% of state minimum + 6.4% 1.5% of State minimum + 7.5% above minimum 1.6% of state minimum + 7.5% above minimum

1.7% of State Minimum + 7.75% above minimum 1.8% of Minimum + 8% above minimum 1.9% of Minimum + 8.25% above minimum 2.0% of Minimum + 8.25% above minimum

Active Member 6.4% 6.4% 6.7% 7.2% 7.7% 7.7% 7.7% 8.00% 8.00% 8.25% 8.25%

*Beginning in fiscal year 2015, school districts and charter schools that do not contribute to Social Security for TRS-eligible employees will contribute to TRS 1.5% of the statutory minimum salary for employees whose positions are subject to the state statutory minimum salary schedule in addition to the state contribution amount on compensation paid in excess of the state minimum amount. For employees whose positions are not subject to the state statutory minimum salary schedule, the employer will contribute 1.5% on the employees’ total salary. **Beginning Sept. 1, 2017, if the state contribution rate is reduced below 6.8%, the contribution rate for active employees will be reduced by an equivalent percentage. If State’s percentage is reduced, then percentage of Active Members is reduced like amount.

By Statute, the state shall contribute to the retirement system an amount equal to at least six and not more than 10 percent of the aggregate annual compensation of all members of the retirement system during that fiscal year.

slide-38
SLIDE 38

“MY TRS” RETIREMENT OUTLOOK

Three Year Five Year

Years of Service % of Annual Salary(3) % of Income Shortfall % Annual Salary(5) % of Income Shortfall

  • 28

64.40%

  • 35.60%

61.21%

  • 38.74%
  • 29

66.70%

  • 33.30%

63.43%

  • 36.57%
  • 30

69.00%

  • 31.00%

65.62%

  • 34.38%
  • 31

71.30%

  • 28.70%

67.81%

  • 32.19%
  • 32

73.60%

  • 26.40%

69.99%

  • 30.01%
  • 33

75.90%

  • 24.10%

74.39%

  • 25.61%
  • 34

78.20%

  • 21.80%

76.54%

  • 23.46%
  • 35

80.50%

  • 19.50%

78.75%

  • 21.25%
  • 36

82.50%

  • 17.20%

80.84%

  • 19.16%
  • 37

85.10%

  • 14.90%

83.44%

  • 16.56%
  • 38

87.90%

  • 12.60%

86.24%

  • 13.76%
  • 39

89.70%

  • 10.30%

88.04%

  • 11.96%
  • 40

92.00%

  • 8.00%

90.34%

  • 09.66%
  • 41

94.30%

  • 5.70%

92.64%

  • 07.26%
  • 42

96.60%

  • 3.40%

95.00%

  • 05.00%
  • 43

98.90%

  • 1.10%

97.24%

  • 02.76%
  • 44

101.20% +1.20% 99.54%

  • 00.46%
  • TRS monthly annuity above does not include the cost of health care, joint survivor benefits, and withholding tax.
  • TRS CURRENTLY DOES NOT PROVIDE AN ANNUAL COST OF LIVING ADJUSTMENT (Offsets inflation)
slide-39
SLIDE 39

DATES

  • TAMS Conference 12/12-13/19

TARS Preconference meeting for all schools on How to Talk to Your Legislator and How to Stay Out of Trouble when Encouraging Staff to Vote at 8:30 (Seliger Comments)

  • TARS Luncheon at Midwinter

12/28/2020 @ 11:30 Hilton

slide-40
SLIDE 40

Dues

  • $450
  • TARS focus is narrow
  • Bills that will benefit financially
  • Bills that will harm financially

(Special Education Bill)

slide-41
SLIDE 41

Major Partner

slide-42
SLIDE 42

Major P Partner

slide-43
SLIDE 43

Major P Partners

slide-44
SLIDE 44

Major P Partner er

slide-45
SLIDE 45

Major P Partner

slide-46
SLIDE 46

Major P Partner er

slide-47
SLIDE 47

Major P Partn tner

slide-48
SLIDE 48

Major P Partner er

slide-49
SLIDE 49

Major P Partn tner

slide-50
SLIDE 50

Michael Lee

tarsed@centex.net 806/202-2764

Leigh Ann Glaze

tars@centex.net 325/372-8552 301 East Wallace Street PO Box 503 San Saba, Texas 76877 Retired Booker ISD 2012 Past Region 16 Board of Directors Former School Board Member Interim Superintendent Rancher/Farmer Retired San Saba ISD 2017 Registrar/Veterans Liaison Howard Payne University Region 15 Board of Directors

Leigh Ann Glaze (325) 372-8552 and Michael Lee (806) 202-2764 Are Honored To Serve You and Your District

slide-51
SLIDE 51

Texas Associati tion o

  • f R

f Rural S Sch chools

Leigh Ann Glaze (325) 372-8552 and Michael Lee (806) 202-2764 Are Honored To Serve You and Your District