
SLIDE 1
7/24/2019 1
Michelle Bina, Cambridge Systematics
presented to presented by
Jingjing Zang (CS) Kevin Kane (SCAG) Anurag Komanduri (CS) Sneha Roy (CS)
co-authors
Telework, Co-working, and Relocation:
How Will Economic and Technological Changes Alter Work Trips
SCAG June 6, 2019
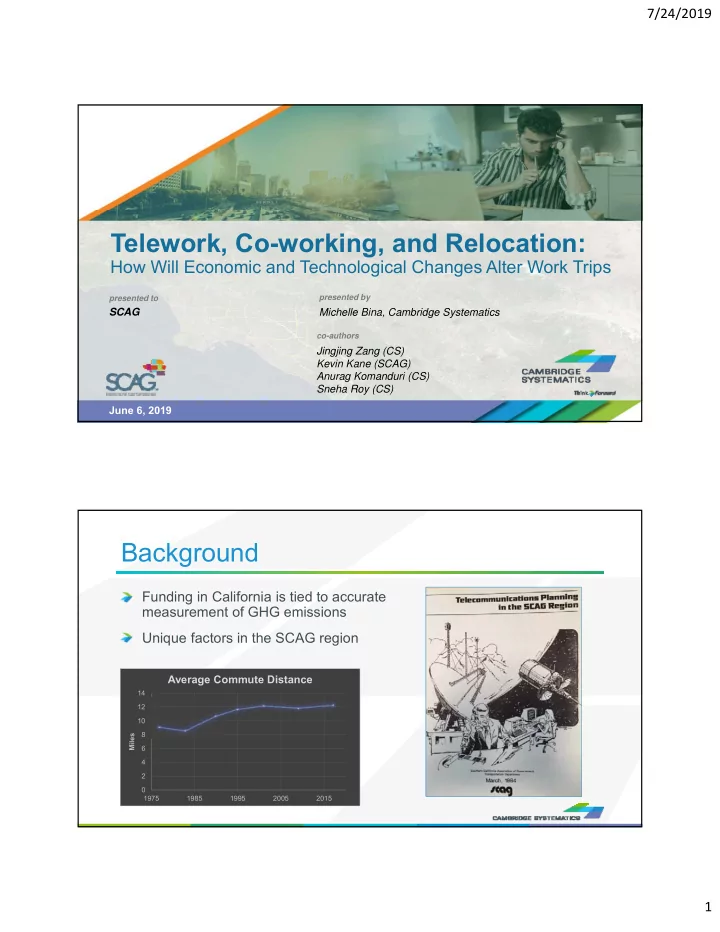
Background
Funding in California is tied to accurate measurement of GHG emissions Unique factors in the SCAG region
2 4 6 8 10 12 14 1975 1985 1995 2005 2015 Miles
Average Commute Distance