
SLIDE 1
20 2020 20 Chen enang ango
- Cou
- unt
nty Te Tentat ative ve bud udge get
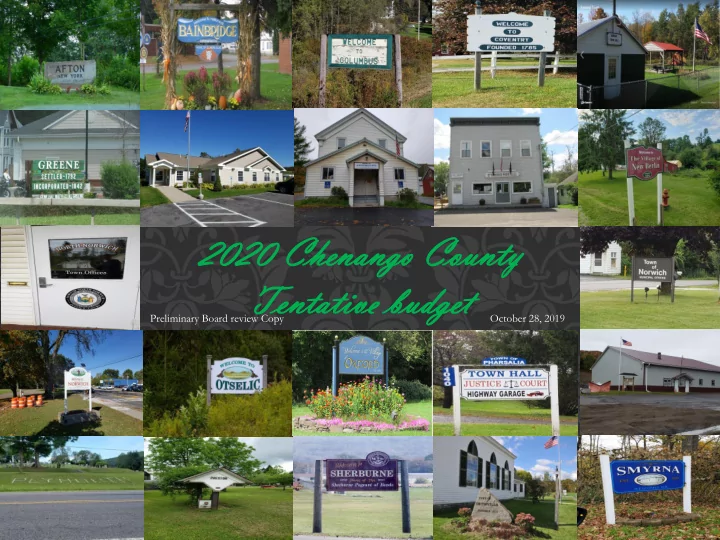
Preliminary Board review Copy October 28, 2019
Te Tentat ative ve bud udge get Preliminary Board review Copy - - PowerPoint PPT Presentation
20 2020 20 Chen enang ango o Cou ount nty Te Tentat ative ve bud udge get Preliminary Board review Copy October 28, 2019 Have a balanced budget using
Preliminary Board review Copy October 28, 2019
A) Subject to Board of Supervisor’s action / revision B) Subject to adjustment until public filing on 11/15/19
CHENANGO COUNTY 2020 PROPERTY TAX RATE DISTRIBUTION How the County Tax Levy is distributed Based on Average Tentative County Rate For every 1,000 Dollars in Taxable Full Value
Culture & Recreation 0.36% Education 3.18% Economic Development 0.36% General Government 4.11% Home & Community Services 3.00% Health 7.40% Public Safety 16.78% County Roads & Transportation 17.86% Social Service Programs 46.96%
Economic Assistance
$ 6.66 County Roads & Transportation $ 2.53 Public Safety $ 2.38 Health $ 1.05 General Government $ 0.58 Education $ 0.45 Home & Community Services $ 0.43
Economic Development
$ 0.05 Culture & Recreation $ 0.05 AVERAGE COUNTY RATE PER THOUSAND $ 14.19
CHENANGO COUNTY 2019 ADOPTED BUDGET REVENUES CHENANGO COUNTY 2020 TENTATIVE BUDGET REVENUES
Real Property Taxes 35.56% Sales Tax 19.76% Other Tax Related Items 3.34% Departmental Income 15.70% State Aid 8.48% Federal Aid 14.32% Applied Surplus 2.83% Real Property Taxes 29.37% Sales Tax 16.40% Other Tax Related Items 2.74% Departmental Income 20.94% State Aid 16.59% Federal Aid 11.70% Applied Surplus 2.26%
CHENANGO COUNTY 2020 TENTATIVE BUDGET APPROPRIATIONS CHENANGO COUNTY 2019 ADOPTED BUDGET APPROPRIATIONS
Culture And Recreation 0.16% Economic Assistance 29.21% Education 1.49% Fringe Benefits 13.06% General Government 7.06% Health 11.91% Home And Community Svces 3.77% Public Safety 12.72% Transportation 20.62% Culture And Recreation 0.16% Economic Assistance 28.23% Education 1.50% Fringe Benefits 12.01% General Government 7.70% Health 12.37% Home And Community Svces 3.85% Public Safety 13.36% Transportation 20.80%
Rank Description Taxable Sales % of Total Taxable Sales Cumulative %
1 Automobile Dealers $96,395,266 16.9% 16.9% 2 Gasoline Stations $54,394,436 9.5% 26.5% 3
$47,385,372 8.3% 34.8% 4 Petroleum and Petroleum Products Merchant Wholesalers $36,479,591 6.4% 41.2% 5 Building Material and Supplies Dealers $35,065,219 6.2% 47.3% 6 Restaurants and Other Eating Places $31,403,005 5.5% 52.8% 7 Wired and Wireless Telecommunications Carriers $20,215,298 3.5% 56.4% 8 Automotive Repair and Maintenance $18,297,495 3.2% 59.6% 9 Electronic Shopping and Mail-Order Houses $12,486,177 2.2% 61.8% 10 Grocery Stores $12,175,950 2.1% 63.9% 11 Electric Power Generation, Transmission and Distribution $10,379,173 1.8% 65.7% 12 Other Miscellaneous Store Retailers $9,207,830 1.6% 67.3% 13 Commercial and Industrial Machinery and Equipment Rental and Leasing $7,472,522 1.3% 68.7% 14 Direct Selling Establishments $7,428,863 1.3% 70.0% 15 Automotive Parts, Accessories, and Tire Stores $7,160,161 1.3% 71.2% 16 Software Publishers $7,041,562 1.2% 72.4% 17 Other Motor Vehicle Dealers $6,690,879 1.2% 73.6% 18 Industrial Machinery Manufacturing $6,566,836 1.2% 74.8% 19 Electronics and Appliance Stores $6,009,657 1.1% 75.8% 20 Computer Systems Design and Related Services $5,557,403 1.0% 76.8% Subtotal Top 20 in Taxable Sales $437,812,695 76.8% Total All Taxable Sales 2017-18 $570,073,353 100.0% Total Vehicle and Truck related Sales $219,417,828 38.50%
Rank Description Taxable Sales % of Total Taxable Sales Cumulative %
1 Automobile Dealers $103,735,878 16.6% 16.6% 2 Gasoline Stations $56,192,191 9.0% 25.6% 3
$47,614,142 7.6% 33.3% 4 Petroleum and Petroleum Products Merchant Wholesalers $42,170,197 6.8% 40.0% 5 Building Material and Supplies Dealers $34,813,652 5.6% 45.6% 6 Restaurants and Other Eating Places $32,427,919 5.2% 50.8% 7 Wired and Wireless Telecommunications Carriers $19,714,183 3.2% 54.0% 8 Automotive Repair and Maintenance $18,767,105 3.0% 57.0% 9 Administration of Economic Programs $17,085,886 2.7% 59.7% 10 Electronic Shopping and Mail-Order Houses $14,332,416 2.3% 62.0% 11 Other Miscellaneous Store Retailers $12,895,063 2.1% 64.1% 12 Industrial Machinery Manufacturing $12,482,107 2.0% 66.1% 13 Grocery Stores $10,922,175 1.8% 67.9% 14 Electric Power Generation, Transmission and Distribution $8,823,859 1.4% 69.3% 15 Direct Selling Establishments $8,221.613 1.4% 70.6% 16 Software Publishers $7,962,817 1.3% 71.9% 17 Automotive parts, Accessories and Tire Stores $7,624,556 1.2% 73.1% 18 Other Motor Vehicle Dealers $7,611,928 1.2% 74.3% 19
$7,517,592 1.2% 75.5% 20 Data Processing, Hosting and Related Services $6,657,276 1.1% 76.6% Subtotal Top 20 in Taxable Sales $477,562,555 76.6% Total All Taxable Sales 2018-19 $623,639,050 100.0% Total Vehicle and Truck related Sales $236,101,855 37.80%
Rank Description – Prior Year ranking in ( ) February 19 Taxable Sales February 18 Taxable Sales Change in Total Sales 1 Automobile Dealers –( 1 ) $103,735,878 $96,395,266 $7,340,612 2 Gasoline Stations – ( 2 ) $56,192,191 $54,394,436 $1,797,755 3
$47,614,142 $47,385,372 $228,770 4 Petroleum and Petroleum Products Merchant Wholesalers – ( 4 ) $42,170,197 $36,479,591 $5,690,606 5 Building Material and Supplies Dealers – ( 5 ) $34,813,652 $35,065,219 $-251,567 6 Restaurants and Other Eating Places – ( 6 ) $32,427,919 $31,403,005 $1,024,914 7 Wired and Wireless Telecommunications Carriers – ( 7 ) $19,714,183 $20,215,298 $-501,115 8 Automotive Repair and Maintenance – ( 8 ) $18,767,105 $18,297,495 $469,610 9 Administration of Economic Programs – ( NR ) $17,085,886 $6,009,657 $11,076,229 10 Electronic Shopping and Mail-Order Houses – ( 9 ) $14,332,416 $12,486,177 $1,846,239 11 Other Miscellaneous Store Retailers – ( 12 ) $12,895,063 $9,207,830 $3,687,233 12 Industrial Machinery Manufacturing – ( 18 ) $12,482,107 $6,566,836 $5,915,271 13 Grocery Stores – ( 10 ) $10,922,175 $12,175,950 $-1,253,775 14 Electric Power Generation, Transmission and Distribution – ( 11 ) $8,823,859 $10,379,173 $-1,555,317 15 Direct Selling Establishments – ( 14 ) $8,221,613 $7,428,863 $792,750 16 Software Publishers – ( 16 ) $7,962,817 $7,041,562 $921,255 17 Automotive parts, Accessories and Tire Stores – ( 15 ) $7,624,556 $7,160,161 $464,395 18 Other Motor Vehicle Dealers – ( 17 ) $7,611,928 $6,690,879 $921,049 19
$7,517,592 $7,472,522 $45,070 20 Data Processing, Hosting and Related Services – ( 20 ) $6,647,276 $5,557,403 $1,089,873 Subtotal Top 20 in Taxable Sales $477,562,555 $437,812,695 $39,749,860 Total All Taxable Sales 2018-19 $623,639,050 $570,073,353 $53,565,697 Total Vehicle and Truck related Sales $236,101,855 $219,417,828 $16,684,027
Above is a chart of the five counties experiencing the greatest population growth and the five counties experiencing the lowest growth since 1970. Counties with the highest growtih rates over the last 48 year have experienced a steady rate of increase in nearly every decade since 1970.
Above is a chart that shows population changes by county in New York State for the 2010 through 2018 periods. Loss in population in much of the state has accelerated since 2010 compared to prior periods.
**Weighted score based on points
New York State Comptrollers Office – Abbreviated Listing – September 2019 Fiscal Year Ending In Class Local Government / School District Name County Stress Designation Region Current Year 1 Year Prior 2 Years Prior Environmental Score
2018 County Chenango Chenango No Designation Southern Tier 0.0 0.0 3.3 26.7
2018 County Allegany Allegany No Designation Western New York 0.0 3.3 12.5 26.7 2018 County Cattaraugus Cattaraugus No Designation Western New York 0.0 3.3 15.8 26.7 2018 County Delaware Delaware No Designation Southern Tier 0.0 0.0 3.3 33.3 2018 County Essex Essex No Designation North Country 0.0 0.0 12.5 40.0 2018 County Greene Greene No Designation Capital District 0.0 0.0 0.0 36.7 2018 County Herkimer Herkimer No Designation Mohawk Valley 0.0 0.0 15.8 36.7 2018 County Jefferson Jefferson No Designation North Country 0.0 9.6 19.2 23.3 2018 County Ontario Ontario No Designation Finger Lakes 0.0 0.0 6.3 6.7 2018 County Putnam Putnam No Designation Mid-Hudson 0.0 3.3 12.9 30.0 2018 County Rensselaer Rensselaer No Designation Capital District 0.0 12.9 25.4 23.3 2018 County Schenectady Schenectady No Designation Capital District 0.0 0.0 22.1 36.7 2018 County Schoharie Schoharie No Designation Mohawk Valley 0.0 0.0 12.9 46.7 2018 County Schuyler Schuyler No Designation Southern Tier 0.0 0.0 6.3 20.0 2018 County Steuben Steuben No Designation Southern Tier 0.0 0.0 15.8 20.0 2018 County Tompkins Tompkins No Designation Southern Tier 0.0 0.0 0.0 16.7 2018 County Warren Warren No Designation Capital District 0.0 0.0 0.0 23.3 2018 County Wayne Wayne No Designation Finger Lakes 0.0 3.3 15.8 20.0 2018 County Yates Yates No Designation Finger Lakes 0.0 0.0 12.5 16.7 2018 County Cayuga Cayuga No Designation Central New York 3.3 3.3 0.0 20.0 2018 County Genesee Genesee No Designation Finger Lakes 3.3 3.3 9.6 20.0 2018 County Hamilton Hamilton No Designation Mohawk Valley 3.3 3.3 12.5 50.0 2018 County Lewis Lewis No Designation North Country 3.3 6.7 19.2 3.3 2018 County Livingston Livingston No Designation Finger Lakes 3.3 3.3 6.3 23.3 2018 County Madison Madison No Designation Central New York 3.3 3.3
2018 County Niagara Niagara No Designation Western New York 3.3 6.7 6.7 16.7 2018 County Tioga Tioga No Designation Southern Tier 3.3 3.3
2018 County Wyoming Wyoming No Designation Finger Lakes 3.3 3.3 19.2 26.7 2018 County Monroe Monroe Moderate Finger Lakes 64.2 69.2 78.8 16.7 2018 County Westchester Westchester Significant Mid-Hudson 69.6 69.6 63.3 33.3 2018 County Nassau Nassau Significant Long Island 72.1 68.8 56.3 20.0 2018 County Suffolk Suffolk Significant Long Island 76.7 76.7 64.2 30.0
Financial Indicators
Fiscal Stress Financial Indicators
2016 2017 2018 1 Assigned and Unassigned Fund Balance as a Percentage (%) of Gross Expenditures 0.0 0.0 0.0 2 Total Fund Balance as a Percentage (%) of Gross Expenditures 0.0 0.0 0.0 3 Operating Deficits 3.33 0.0 0.0 4 Cash Ratio - Cash and Investments as a Percentage (%) of Current Liabilities 0.0 0.0 0.0 5 Cash as a Percentage (%) of Monthly Gross Expenditures 0.0 0.0 0.0 6 Short-Term Cash-Flow Debt Issuance as a Percentage (%) of Total Revenues 0.0 0.0 0.0 7 Short-Term Cash-Flow Debt Issuance Trend 0.0 0.0 0.0 8 Personal Service and Employee Benefits as a Percentage (%) of Total Revenues (3 year avg) 0.0 0.0 0.0 9 Debt Service as a Percentage (%) of Total Revenues (3 year avg) 0.0 0.0 0.0 Total Points* 3.33 0.0 0.0 Score Classification
No Designation No Designation No Designation
Value Score
Fiscal Stress Environmental Indicators
2018 1 Change in Population
6.67 2 Percent of Households with Public Assistance 18.89% 3 Percent of Population Under 18 & Over 65 40.40% 4 Percent Change in Home Value 6.08% 6.67 5 Median Household Income $48,567 6 Unemployment Rate 6.70% 7 Reliance on State and Federal Aid 23.49% 13.33 Total Points* 26.7 Score Classification
No Designation
As Defined in law, the allowable levy growth factor is the lesser of one plus the inflation factor or one and two-one-
plus the inflation factor.
2.00% 1.66% 1.56% 0.73% 0.68% 1.84% 2.38% 2.39% 0.00% 0.50% 1.00% 1.50% 2.00% 2.50% 3.00% 2013 2014 2015 2016 2017 2018 2019 2020 est Inflation Factor Fiscal Year Beginning
FYE 12/31
FYE 12/31
12.00 12.50 13.00 13.50 14.00 14.50 15.00 15.50 16.00 2011 2012 2013 2014 2015 2016 2017 2018 2019 2020 Tax Rate Per Thousand Year
Chenango County 10 Year Tax Rate Comparison
Tax Cap Cap Imp Impose sed
15 16 17 18 19 20 21 22 23 24 25 2010 2011 2012 2013 2014 2015 2016 2017 2018 2019 2020 Millions Years
Proj. Est.
1.7 1.75 1.8 1.85 1.9 2016 2017 2018 2019 2020 IN BILLIONS YEAR
$0 $1,000,000 $2,000,000 $3,000,000 $4,000,000 $5,000,000 $6,000,000 2011 2012 2013 2014 2015 2016 2017 2018 2019 2020 Applied Fund Balance Appropriation Of Surplus During The Fiscal Year Est.
Mandated programs require a county to strictly adhere to rules set by the state, which define the scope, eligibility, frequency and level of service, amount of benefits, etc. The State also controls the levels of funding participation for these mandated programs Counties have virtually no ability to control the cost of these state dictated mandates. According to NYSAC, over the next several years the State will implement state tax rebate check programs and tax breaks for select special interest groups and industrial sectors, not including STAR, that will exceed $3 billion on an annual basis – none of which will actually reduce any homeowner’s or small businesses’ property tax bills. New York State has required county taxpayers to finance with local property taxes dozens of state mandated programs that, for the most part, other states do not finance through property taxes. We believe that
just to slow the rate of growth in property taxes, but to actually lower them from today’s
Government, that defines and controls them, will result in an historic and sustainable reduction in county property taxes and create a more appropriate and equitable distribution
Combined, the following ten mandated programs make up 81.57% of the tentative County tax levy for 2020 compared to 80.35% in 2019.
MEDICAID- EACH WEEK COUNTIES AND NYC SEND $140 MILLION IN LOCAL TAXES TO STATE BANK ACCOUNTS, IN ORDER TO COVER COSTS FOR THE STATE MEDICAID PROGRAM. COUNTIES IN NEW YORK SPEND MORE ON MEDICAID THAN ALL THE COUNTIES IN THE REST OF THE NATION COMBINED. THESE ARE BIG NUMBERS AND THEY HAVE BIG IMPACTS ON LOCAL PROPERTY TAXPAYERS. THE POSITIVE THING IS THAT THE STATE CAPPED THE GROWTH IN LOCAL MEDICAID COSTS TO NO MORE THAN 3 % PER YEAR BEGINNING IN 2005, AND BEGINNING IN 2015 THESE COSTS ARE TO NO LONGER GROW. IMPACT TO 2020 TAX LEVY 9,885,856 PERCENT OF 2020 TAX LEVY 37.43%
$9,750,000 $9,800,000 $9,850,000 $9,900,000 $9,950,000 $10,000,000 $10,050,000 $10,100,000 2016 2017 2018 2019 2020
CHENANGO COUNTY MEDICAID COSTS
TEMPORARY ASSISTANCE FOR NEEDY FAMILIES-(TANF)-PROVIDES TIME-LIMITED CASH ASSISTANCE AND NON-CASH SUPPORT SERVICES TO LOW INCOME FAMILIES. THE IMPACT OF THE STATE WITHDRAWING ITS FISCAL COMMITMENT TO THEIR PROGRAMS PUTS COUNTIES AT FULL FINANCIAL RISK FOR ADMINISTERING THESE PROGRAMS AND HAS SHIFTED MORE THAN $300 MILLION ANNUALLY TO COUNTIES’ TAXPAYERS IN ORDER TO BACKFILL THE LOSS OF STATE ADMINISTRATIVE FUNDING. IMPACT TO 2020 TAX LEVY $701,520 PERCENT OF 2020 TAX LEVY 2.66%
$0 $200,000 $400,000 $600,000 $800,000 $1,000,000 $1,200,000 2015 2016 2017 2018 2019 2020
CHENANGO COUNTY TEMPORARY ASSISTANCE FOR NEEDY FAMILIES COSTS
SAFETY NET-WHILE THE PROGRAM HISTORICALLY WAS FUNDED 50 PERCENT BY THE STATE AND 50 PERCENT BY COUNTIES, THE 2011-12 STATE BUDGET INCREASED THE LOCAL SHARE TO 71 PERCENT AND DROPPED THE STATE SHARE TO 29 PERCENT. INDIGENT BURIALS MANDATED UNDER THIS PROGRAM ARE SUBSIDIZED BY THE STATE AT $261.00 PER BURIAL. IMPACT TO 2020 TAX LEVY $560,000 PERCENT OF 2020 TAX 2.12%
$0 $100,000 $200,000 $300,000 $400,000 $500,000 $600,000 $700,000 $800,000 $900,000 2015 2016 2017 2018 2019 2020
CHENANGO COUNTY SAFETY NET COSTS
CHILD WELFARE-COUNTIES ADMINISTER AND FUND A SHARE OF THE COSTS OF PROVIDING CHILD WELFARE SERVICES TO CHILDREN AND FAMILIES IN NEED. THESE ACTIVITIES INCLUDE SERVICES, INTERVENTIONS AND INVESTIGATIONS DESIGNED TO PREVENT CHILD ABUSE AND PROTECT CHILDREN’S WELFARE. OVER THE LAST TWO BUDGET CYCLES THE STATE HAS CUT ITS SHARE OF NON-FEDERAL FUNDING FROM ABOUT 65 PERCENT DOWN TO 62 PERCENT, SHIFTING ABOUT $60 MILLION IN COSTS TO COUNTIES, WHICH NOW COVER 38 PERCENT OF THE COSTS FOR CHILD WELFARE. THESE COST SHIFTS RESULT IN DIRECT COST INCREASES FOR LOCAL PROPERTY TAXPAYERS TO SUPPORT STATE PROGRAM. IMPACT TO 2020 TAX LEVY $944,500 PERCENT OF 2020 TAX LEVY 3.58%
$0 $200,000 $400,000 $600,000 $800,000 $1,000,000 $1,200,000 $1,400,000 $1,600,000 2015 2016 2017 2018 2019 2020
CHENANGO COUNTY CHILD WELFARE COSTS
INDIGENT DEFENSE-AS REQUIRED BY CONSTITUTIONAL MANDATE, NEW YORK ENACTED ARTICLE 18-B OF THE COUNTY LAW THAT REQUIRES EACH COUNTY TO ESTABLISH A PLAN TO PROVIDE COUNSEL TO INDIGENT DEFENDANTS. ONE OF THE MAJOR PROBLEMS WITH THIS SYSTEM IS THAT IT PLACES SIGNIFICANT FINANCIAL BURDEN ON THE COUNTIES AS WELL AS POTENTIALLY HUGE, UNEXPECTED COST SWINGS BETWEEN FISCAL YEARS. CURRENT LEGISLATION PASSED UNANIMOUSLY BY THE STATE LEGISLATURE, CURRENTLY SITS ON THE GOVERNOR'S DESK UNSIGNED. IMPACT TO 2020 TAX LEVY $412,813 PERCENT OF 2020 TAX LEVY 1.56%
$0 $100,000 $200,000 $300,000 $400,000 $500,000 $600,000 $700,000 2015 2016 2017 2018 2019 2020
CHENANGO COUNTY INDIGENT DEFENSE COSTS
PRESCHOOL SPECIAL EDUCATION AND EARLY INTERVENTION -EVEN THOUGH COUNTIES CONTINUE TO BEAR THE FINANCIAL BURDEN FOR SERVICE. FEDERAL AND STATE LAW PLACES RESPONSIBILITY FOR THE PROGRAM WITH THE EDUCATION SYSTEM AND GIVES DECISION-MAKING AUTHORITY TO SCHOOL DISTRICTS. THE EARLY INTERVENTION PROGRAM (EIP) PROVIDES SERVICES TO CHILDREN 0-3 YEARS OF AGE WHO HAVE DEVELOPMENTAL DELAYS OR DISABILITIES. SINCE ITS INCEPTION, THE COST TO PROVIDE SERVICES TO ELIGIBLE CHILDREN HAS INCREASED DRAMATICALLY.
IMPACT TO 2020 TAX LEVY $1,132,444 PERCENT OF 2020 TAX LEVY 4.29%
$850,000 $900,000 $950,000 $1,000,000 $1,050,000 $1,100,000 $1,150,000 2015 2016 2017 2018 2019 2020
CHENANGO COUNTY PRESCHOOL EDUCATION AND EARLY INTERVENTION COSTS
PROBATION-PROBATION SERVICES ARE PROVIDED BY COUNTIES AS MANDATED UNDER NEW YORK STATE EXECUTIVE LAW. OVER THE LAST SEVERAL DECADES, STATE REIMBURSEMENT TO COUNTIES FOR PROBATION HAS DWINDLED, LEAVING COUNTIES TO SHOULDER AN INCREASING SHARE OF THE COSTS FOR THIS PROGRAM - 82.81 % OF COSTS ARE NOW SUPPORTED BY COUNTY TAXPAYERS.
IMPACT TO 2020 TAX LEVY $474,334 PERCENT OF 2020 TAX LEVY 1.80%
$0 $50,000 $100,000 $150,000 $200,000 $250,000 $300,000 $350,000 $400,000 $450,000 $500,000 2015 2016 2017 2018 2019 2020
CHENANGO COUNTY PROBATION COSTS
JAIL AND CORRECTIONAL FACILITY-COUNTIES ARE REQUIRED UNDER STATE LAW TO OPERATE AND MAINTAIN LOCAL JAILS AT LOCAL EXPENSE. THE STATE DETERMINES THE STANDARDS FOR THE OPERATION AND MAINTENANCE OF JAIL FACILITIES INCLUDING MANDATORY STAFFING LEVELS, SIZE AND CONSTRUCTION OF THE FACILITIES WITH LITTLE REGARD FOR COST SAVINGS AND EFFICIENCIES IMPACT TO 2020 TAX LEVY $1,633,458 PERCENT OF 2020 TAX LEVY 6.19%
$0 $200,000 $400,000 $600,000 $800,000 $1,000,000 $1,200,000 $1,400,000 $1,600,000 $1,800,000 2015 2016 2017 2018 2019 2020
CHENANGO COUNTY CORRECTIONAL FACILITY COSTS
NYS RETIREMENT FUND-COUNTIES ARE REQUIRED TO PARTICIPATE IN THE NEW YORK STATE PUBLIC EMPLOYEES RETIREMENT SYSTEM, ALONG WITH OTHER LOCAL GOVERNMENTS. HOWEVER, COUNTIES HAVE NO CONTROL OVER PENSION COSTS OR BENEFITS AWARDED TO THEIR OWN EMPLOYEES AS THESE BENEFIT LEVELS ARE DETERMINED BY THE GOVERNOR AND STATE LEGISLATURE. IMPACT TO 2020 TAX LEVY $3,600,523 PERCENT OF 2020 TAX LEVY 13.63%
$0 $500,000 $1,000,000 $1,500,000 $2,000,000 $2,500,000 $3,000,000 $3,500,000 $4,000,000 2015 2016 2017 2018 2019 2020
CHENANGO COUNTY NYS RETIREMENT FUND COSTS
COMMUNITY COLLEGE FUNDING-COSTS ASSOCIATED WITH COMMUNITY COLLEGES WERE ESTABLISHED UNDER STATE LAW AS A THREE WAY PARTNERSHIP BETWEEN THE STATE, COUNTY AND THE STUDENT WITH AN EXPECTATION AND STATUTORY REQUIREMENT THAT EACH WOULD SHARE EQUALLY IN THE COST OF PROVIDING EDUCATIONAL SERVICES. OVER THE YEARS THE EQUAL SHARING OF COSTS ARRANGEMENT HAS BEEN BREACHED BY THE STATE LEGISLATURE THROUGH PERMANENT LAW FORMULA OVERRIDES AS PART OF THE ANNUAL STATE BUDGET PROCESS AND TO ADDRESS STATE BUDGET SHORTFALLS. A RECENT TREND IS FOR COMMUNITY COLLEGES TO SPONSOR CREDIT BEARING COURSES IN DISTRICT HIGH SCHOOLS USING DISTRICT STAFF AND FACILITIES AND CHARGING BACK COUNTIES FOR SPONSORED FTE UNITS AS WELL AS CAPITAL CHARGEBACKS FOR ON-CAMPUS INFRASTRUCTURE IMPROVEMENTS. COMMUNITY COLLEGE CHARGES ASSOCIATED WITH THESE COURSES INCREASED MANDATED CHARGEBACK COSTS BY 22.75% IN 2014. IMPACT TO 2020 TAX LEVY $1,350,000 PERCENT OF 2020 TAX LEVY 5.11% *A2490A
200000 400000 600000 800000 1000000 1200000 1400000 1600000 2015 2016 2017 2018 2019 Proj 2020 EST
COMMUNITY COLLEGE CHARGEBACKS
General Charges High School Charges
.
THE 2020 BUDGET INCLUDES OVER $ 845,000 OF ADDITIONAL LOCAL COST FOR NEWLY ADOPTED NYS MANDATED PROGRAMS FOR: LEAD TESTING ($ 120,000); EARLY VOTING ($ 80,000); PROBATION SUPERVISION ( $ 80,000); CASHLESS BAIL ( $ 60,000); ADDED DA EXPENSES ( $ 185,000); AND THE COUNTY’S ASSUMPTION OF AIM FUNDING TO LOCAL MUNICIPALITIES ($ 320,000). THESE NEW MANDATES WILL DRIVE OUR 2020 SPENDING UP BY ABOUT 8/10THS OF ONE PERCENT.
IMPACT TO 2020 TAX LEVY $845,000 PERCENT OF 2020 TAX LEVY 3.20%
$0 $50,000 $100,000 $150,000 $200,000 $250,000 $300,000 $350,000 Elections District Attorney Public Health Cashless Bail Probation AIM Funding 80,000.00 185,000.00 120,000.00 60,000.00 80,000.00 320,000.00
New Mandates for 2020
Objectives: 1. Keep our physical plant up to date.
1. Court Facility ------------------------------------------------------>
2. Landfill ------------------------------------------------------------>
3. Sheriff and Correctional Facility ------------------------------->
$ 50,000 per year (2019 and future)
4. County Office Building ------------------------------------------>
access on 1960, 1974 and 1991 wing.
the range of 4.5 million
budget
Note : $ 35,000,000 borrowed for 30 years at 3% interest will generate $ 18,125,000 in interest expense or about $ 600,000 per year. Our annual tax cap is about $ 600,000 per year.
$ 15,000,000.00 - AVOIDED Completed Funded and Open $ 6,000,000.00 1 million set aside as of 10/31/19 $ 2,000,000.00 – 3,000,000.00 Pending Board of Supervisors discussion $ 5,000,000.00 - $ 7,000,000.00 ( exact estimate uncertain) Pending Board of Supervisors Discussion
Estimated 2025 Capital Costs
2020