
SLIDE 1
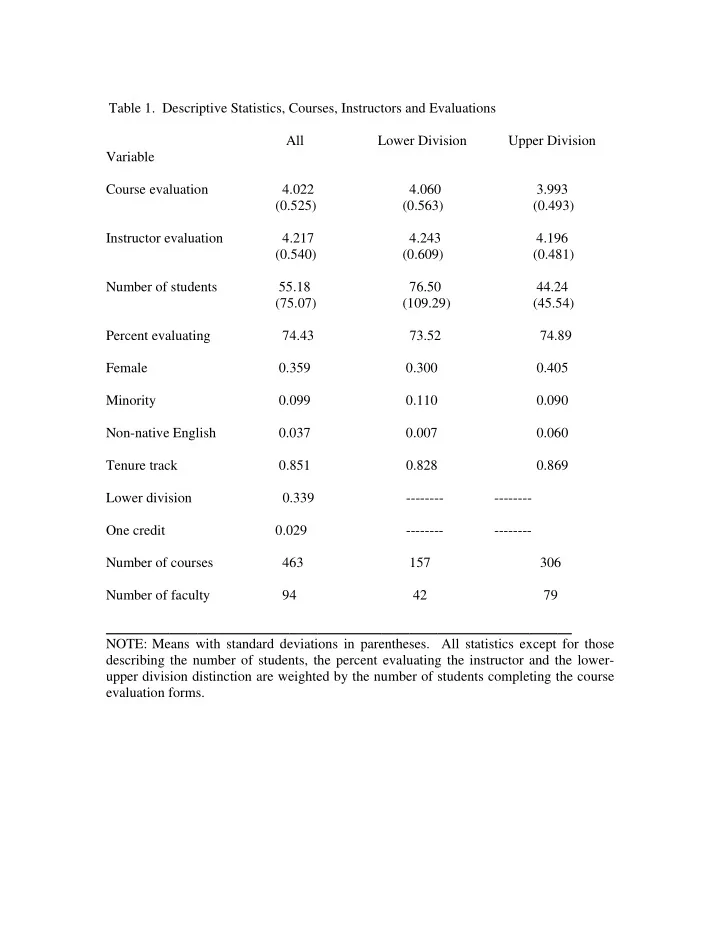
Table 1. Descriptive Statistics, Courses, Instructors and Evaluations
All Lower Division Upper Division Variable Course evaluation 4.022 4.060 3.993 (0.525) (0.563) (0.493) Instructor evaluation 4.217 4.243 4.196 (0.540) (0.609) (0.481) Number of students 55.18 76.50 44.24 (75.07) (109.29) (45.54) Percent evaluating 74.43 73.52 74.89 Female 0.359 0.300 0.405 Minority 0.099 0.110 0.090 Non-native English 0.037 0.007 0.060 Tenure track 0.851 0.828 0.869 Lower division 0.339
- One credit
0.029
- Number of courses