
SLIDE 1
T
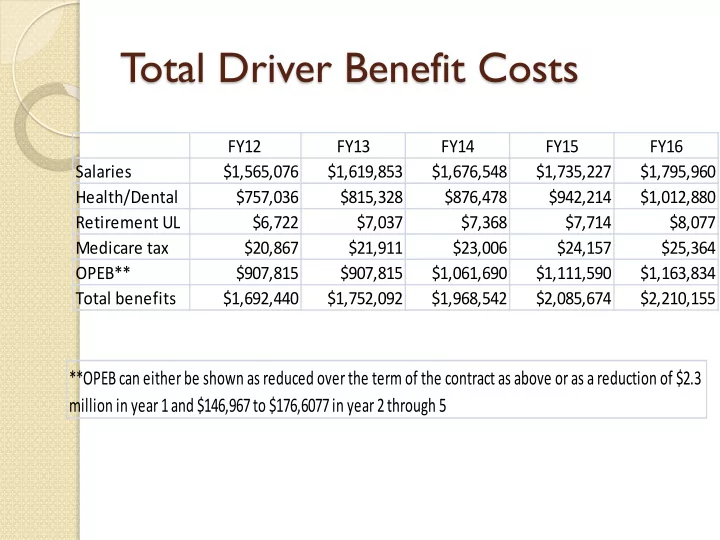
- tal Driver Benefit Costs
**OPEB can either be shown as reduced over the term of the contract as above or as a reduction of $2.3 million in year 1 and $146,967 to $176,6077 in year 2 through 5
FY12 FY13 FY14 FY15 FY16 Salaries $1,565,076 $1,619,853 $1,676,548 $1,735,227 $1,795,960 Health/Dental $757,036 $815,328 $876,478 $942,214 $1,012,880 Retirement UL $6,722 $7,037 $7,368 $7,714 $8,077 Medicare tax $20,867 $21,911 $23,006 $24,157 $25,364 OPEB** $907,815 $907,815 $1,061,690 $1,111,590 $1,163,834 Total benefits $1,692,440 $1,752,092 $1,968,542 $2,085,674 $2,210,155