
SLIDE 1
Systems production ceiling Our Land and Water National Science - - PowerPoint PPT Presentation
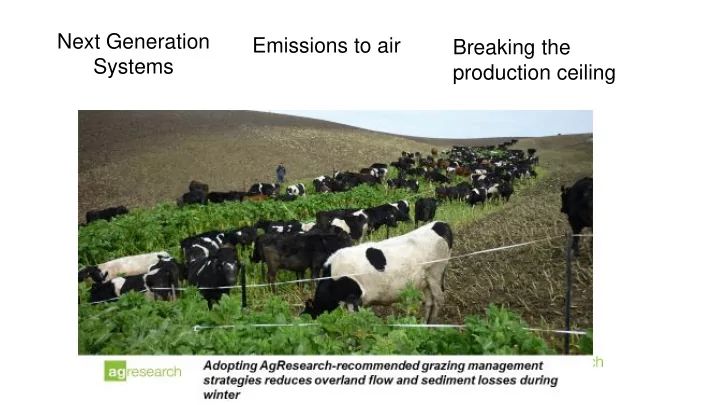
Next Generation Emissions to air Breaking the Systems production ceiling Our Land and Water National Science Challenge Toit te Whenua Toiora te Wai Next Generation Systems Robyn Dynes , Anita Wreford, Alan Renwick, Warren King, Paul
Our Land and Water National Science Challenge Toitū te Whenua Toiora te Wai
Carolyn Hedley, Grant Edwards.
Weighting of each alternative under each criteria – sheep dairy example
0.00 0.10 0.20 0.30 0.40 0.50 0.60 0.70 0.80 0.90 1.00
Capital investment Profit/ha Return on Investment Payback Period Variability in Profit Income diversification Scale of market Ability to capture value added Variability of supply Supply chain strength Availability of Labour Local Employment Conditions of Employment Noise/Visual Impact Cultural Values Value Distribution (multiplier effect) Quality of Life Nitrate Leaching Erosion/Sediment GHG Emissions P Losses Disease (Ecoli etc) Env Stewardship Similarity to current system State of my knowledge Extent system is proven Available Advisory support State of Technology Confidence Health and Safety Food safety Animal Welfare Water Building Greenhouse Gas
Supply chain strength
Mitigation Farm optimisation System reset Impact per $ spent Time
Challenge science Aligned science
Industry
Science
20 March 2019 |
8
Previous Modelling More efficient systems based on 5-point plan: 1.High BW lower SR 2.NI + reduced N fert 3.Reduce replacements 4.High energy/low N 5.Stand-off/housing P21 Phase II Dairy systems trials incorporating (parts of) this 5- point plan: a) Waikato (1, 2, 3, 4, 5) b) Canterbury (1, 2, 3, 4) c) South Otago (2, 3, 4, 5) Evaluate and demonstrate feasibility, practicality, financial returns, and other environmental impacts of a range of pastoral systems NZAGRC Integrated Farm Systems – Dairy Evaluate and demonstrate GHG emissions intensity
20 March 2019 |
9
5-point plan Waikato Canterbury South Otago OPT RES
worth lower SR
replacement rates
Grain Diverse pasture Fodder beet
Cereal
Programme Integrated Farm systems Outcome/Impact Area Dairy Systems
7
Can’t measure GHG losses from entire system! Instead: 1. Use ‘Inventory’ type calculations 2. Combined with targeted CH4 and N2O measurements 3. ‘Source’ detailed systems data from P21 partners To apply the models in practice: a farm systems evaluation of practices that reduced GHG emissions intensity in modelling studies.
Programme Integrated Farm systems Outcome/Impact Area Dairy Systems
7
emission factors for combinations of farm practices within practical systems
comparisons
environmental losses to water. Key message: to demonstrate impact of changed practices must have accurate and relevant GHG emissions data
Off-farm fertiliser Off-farm grain CH4 – WC total CH4 – MP total N2O – WC total N2O – MP total
$2,175* $1,555*
*Operating profit ($/ha MP) @ pay-out of $5.10/kg MS Low SR High SR Low SR High SR
Farmers: Farmer, Industry, Rural professionals and Researchers Co-development towards a shared problem - shared solutions
developed
‘grounded’ on commercial farms
component research
and sector
Joint benefits:
20/03/2019 Sores and Supply Conference July 2015
Rate of water application (mm)
Component research and AgResearch Science to assess key leverage points Rate of water application (mm)
90 grass grub