
SLIDE 1
2/16/2011 1
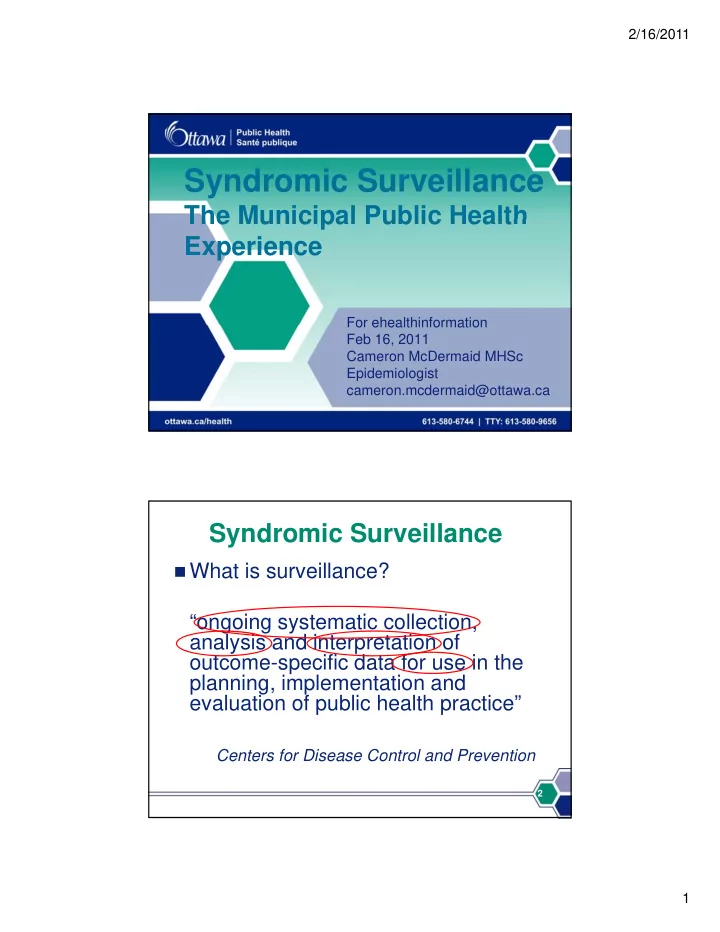
Syndromic Surveillance
The Municipal Public Health The Municipal Public Health Experience
For ehealthinformation For ehealthinformation Feb 16, 2011 Cameron McDermaid MHSc Epidemiologist cameron.mcdermaid@ottawa.ca
Syndromic Surveillance
What is surveillance?
“ongoing systematic collection, analysis and interpretation of
- utcome-specific data for use in the
planning, implementation and evaluation of public health practice”
2