Susitna River Chinook Salmon Escapement Goals 1 Recommended - - PDF document

susitna river chinook salmon escapement goals
SMART_READER_LITE
LIVE PREVIEW

Susitna River Chinook Salmon Escapement Goals 1 Recommended - - PDF document

Susitna River Chinook Salmon Escapement Goals 1 Recommended Northern Cook Inlet King Salmon Escapement Goals Talkeetna River Eastside Susitna River Yentna River Area of Detail 2 Map showing current single aerial survey index streams with


slide-1
SLIDE 1

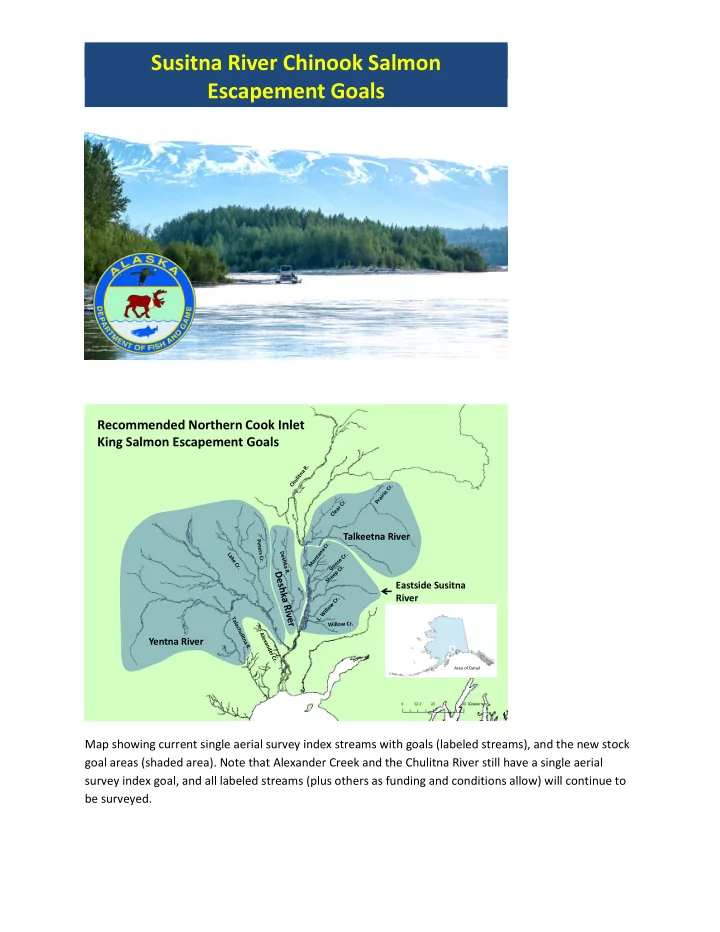
Map showing current single aerial survey index streams with goals (labeled streams), and the new stock goal areas (shaded area). Note that Alexander Creek and the Chulitna River still have a single aerial survey index goal, and all labeled streams (plus others as funding and conditions allow) will continue to be surveyed.

Susitna River Chinook Salmon Escapement Goals

1

Area of Detail

Recommended Northern Cook Inlet King Salmon Escapement Goals

Eastside Susitna River Talkeetna River Yentna River

2

slide-2
SLIDE 2

Diagram depicting the inputs and outputs of the run reconstruction/ stock recruit model used to develop new escapement goals and estimate escapements to assess annual performance of each stock relative to the goals. Example of escapements (top graph), and returns per spawner (bottom graph) from stock-recruit analysis, for illustration purposes (data not from Susitna River Chinook).

State – Space Model

Weir counts Age data Harvest data Aerial surveys Mark- recapture abundance

Run Reconstruction (Escapements) Stock Recruit analysis (Escapement Goals)

Susitna Chinook Run Reconstruction Design

4

Example of Outputs

slide-3
SLIDE 3

Weir counts for years 2004 – 2019 (blue bars) and updated escapement goal range (9,000 – 18,000 fish, red lines) for Deshka River Chinook salmon. Modeled escapement values for 2004 – 2017 (blue bars), and escapement goal range (13,000 – 25,000 fish, red lines) for the Eastside Susitna River Chinook salmon stock. Fraction above escapement indicates single aerial surveys that met the low end of the current goal (numerator) versus the number of surveys completed that year (denominator).

5

10,000 20,000 30,000 40,000 50,000 60,000 70,000

Deshka River

Stock Goals and Recent Escapements

6

Stock Goals and Recent Escapements

5,000 10,000 15,000 20,000 25,000 30,000 35,000 40,000

Eastside Susitna River

4/5 5/5 4/5 1/5 1/5 3/4 1/5 3/3 2/3 1/4 2/5 1/3 2/5 1/4

slide-4
SLIDE 4

Modeled escapement values for 2004 – 2017 (blue bars), and escapement goal range (9,000 – 17,500 fish, red lines) for the Talkeetna River Chinook salmon stock. Fraction above escapement indicates single aerial surveys that met the low end of the current goal (numerator) versus the number of surveys completed that year (denominator). Modeled escapement values for 2004 – 2017 (blue bars), and escapement goal range (13,000 – 22,000 fish, red lines) for the Yentna River Chinook salmon stock. Fraction above escapement indicates single aerial surveys that met the low end of the current goal (numerator) versus the number of surveys completed that year (denominator).

7

Stock Goals and Recent Escapements

5,000 10,000 15,000 20,000 25,000 30,000

Talkeetna River

2/2 2/2 1/2 2/2 0/2 0/2 1/2 2/2 1/2 2/2 0/2 0/1 2/2 2/2

8

Stock Goals and Recent Escapements

10,000 20,000 30,000 40,000 50,000 60,000 70,000

Yentna River

1/2 2/3 2/3 0/3 3/3 3/3 3/3 3/3 0/3 0/2 3/3 3/3 3/3 3/3

slide-5
SLIDE 5

Chinook salmon productivity for each of four Susitna Chinook salmon stocks, 1979 - 2014. Points above zero line (Y-axis) represent above average productivity, and those below represent below average productivity.

Susitna Chinook Productivity

9

Susitna Chinook Run Reconstruction and EG Analysis Summary

  • This approach is advantageous for setting escapement

goals because it uses all available data sets to describe the stock recruit relationship for Susitna Chinook, and stocks are the level we manage to.

  • A detailed report of this analysis is scheduled for

publication in early winter 2020.

  • Questions?

10