
SLIDE 1
1
Supporting Facility and Process Flows
1
Servicescapes Process Flow Structures Process Performance Facility Layout
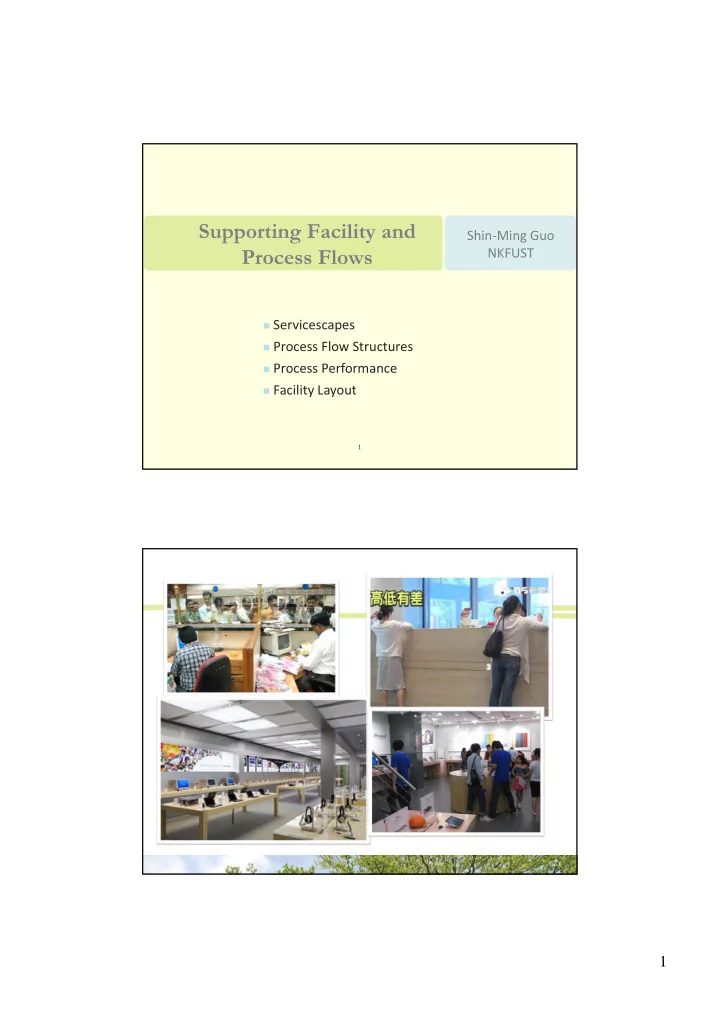
Supporting Facility and Shin Ming Guo Process Flows NKFUST - - PDF document
Supporting Facility and Shin Ming Guo Process Flows NKFUST Servicescapes Process Flow Structures Process Performance Facility Layout 1 1 Environmental Psychology & Orientation Need for spatial cues to orient visitors
1
Servicescapes Process Flow Structures Process Performance Facility Layout
Need for spatial cues to orient visitors Place orientation (e.g., "Where am I?") Function orientation (e.g., "How does this
Formula facilities draw on previous experience Anxiety and a sense of helplessness can result if
6
7
9
A process is a set of activities that accepts inputs and
Processes can involve both goods and services.
Process flowcharting is the use of a diagram to present the
The design of a product or services has a major impact on the
What operations are needed? What is the right sequence? 10
11
12
13
14
15
16
1 1 1 2 2 2 3 3 3 4 4 A B C Raw materials Assembly Drilling work center Painting work center Milling work center Lathe work center D
17
18
20
Low Volume (unique) Medium Volume (high variety) High Volume (lower variety) Very high volume (standardized) Utilization of fixed capital generally too low Unit variable costs generally too high Commercial Printer Apparel Production High volume Auto assembly Oil refinery Low volume Auto Assembly
21
22
23
24
Process Cycle time = 0.5 min. Capacity = 120/hour. Direct labor content = 2.5 min. Direct Labor Utilization = 2.5/(5×0.5)=100%
25
Throughput rate = average daily sales Throughput time = days of supply Days of supply = Inventory turn =
26
27
28
29
30
31 10 6 6 10 7 5 6 20 4 3 6 6 20 1 7 10 15 2 8 3 10 15 8 8 20 6 30 15 30 8 10 40 12 6 8 5 30 10 10
A B C D E F A B C D E F A B C D E F
Net flow
Flow matrix Triangularized matrix Description of attractions: A=killer whale, B=sea lions, C=dolphins, D=water skiing, E=aquarium, F=water rides.
32
(a) Initial layout (b) Move C close to A
Pair Flow distances Pair Flow distances AC 30 x 2 = 60 CD 20 x 2 =40 AF 6 x 2 = 12 CF 8 x 2 =16 DC 20 x 2 = 40 DF 6 x 2 = 12 DF 6 x 2 = 12 AF 6 x 2 = 12 Total 124 CE 8 x 2 = 16 Total 96
(c ) Exchange A and C (d) Exchange B and E and move F
Pair Flow distances Pair Flow distances AE 15 x 2 = 30 AB 15 x 2 = 30 CF 8 x 2 = 16 AD 0 x 2 = 0 AF 6 x 2 = 12 FB 8 x 2 = 16 AD 0 x 2 = 0 FD 6 x 2 = 12 DF 6 x 2 = 12 Total 58 Total 70 A B C D E F A C D B E F C A D B F E A F C E D B
33
High contact service: throughput rate, wait times Retail service: inventory
34