
SLIDE 1
Summary of Sample analysed Species Number Number Proportion - - PowerPoint PPT Presentation
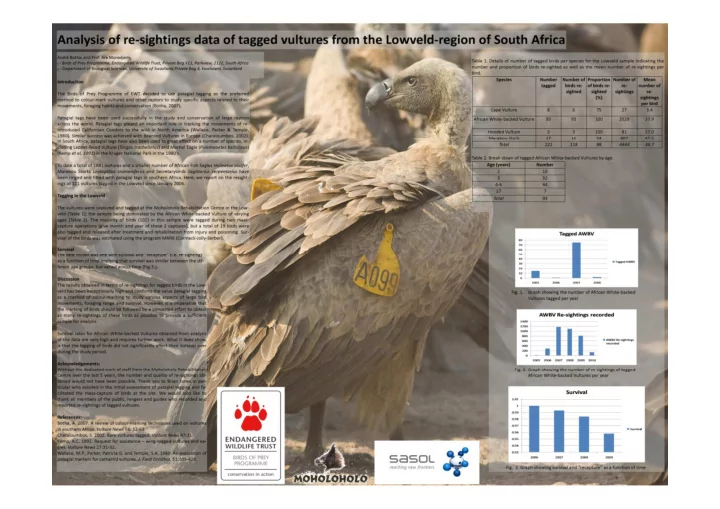
Summary of Sample analysed Species Number Number Proportion Number Mean tagged of birds of birds re- of re- number of re-sighted sighted (%) sightings re-sightings per bird Cape Vulture 8 6 75 27 3.4 African White-backed 93
Species Number tagged Number
re-sighted Proportion
sighted (%) Number
sightings Mean number of re-sightings per bird
Cape Vulture
8 6 75 27 3.4
African White-backed Vulture
93 93 100 3529 37.9
Hooded Vulture
3 3 100 81 27.0
Marabou Stork
17 16 94 807 47.5
Total
121 118 98 4444 36.7
10 20 30 40 50 60 70 80 2005 2006 2007 2008 Tagged AWBV
200 400 600 800 1000 1200 1400 2005 2006 2007 2008 2009 2010 AWBV Re-sightings recorded
0.93 0.94 0.95 0.96 0.97 0.98 0.99 1 1.01 2006 2007 2008 2009 Survival
– various aspects of large bird movements – foraging range – survival
required
high – requires more detailed analyses