
SLIDE 1
Success and Failure of Implementing Data-driven Upscaling Using Flux - - PowerPoint PPT Presentation
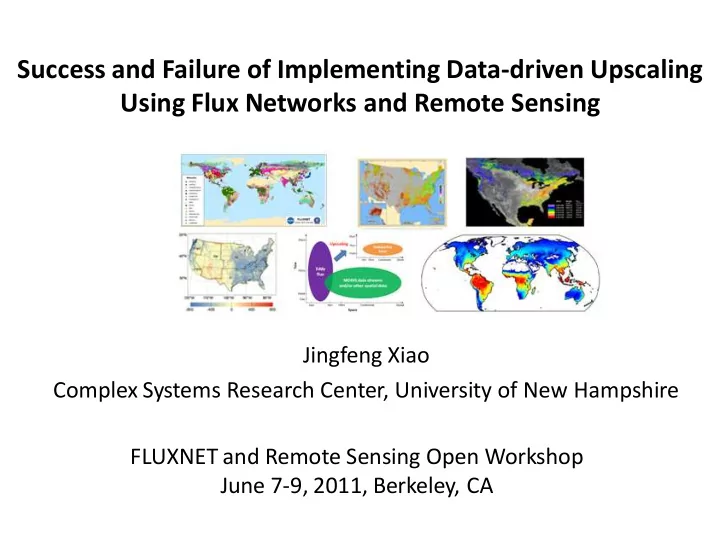
Success and Failure of Implementing Data-driven Upscaling Using Flux Networks and Remote Sensing Jingfeng Xiao Complex Systems Research Center, University of New Hampshire FLUXNET and Remote Sensing Open Workshop June 7-9, 2011, Berkeley, CA
Gridded flux fields
Xiao et al., 2008
Xiao et al., JGR, accepted; Xiao et al., in preparation
Wylie et al. 2007 Zhang et al. 2011 Xiao et al., 2008, 2010, 2011 Sun et al. 2011 Ichii et al. 2010
Jung et al.2009, 2010 Beer et al. 2010 Xiao et al. in preparation
Xiao et al., JGR, accepted Papale and Valentini et al. 2003
Yuan et al. 2010
Xiao et al., RSE, 2010; Agri. For. Met., 2011
Huntzinger et al. in preparation
Dang et al., JGR, accepted
Deng et al. in preparation
Huntzinger et al. in preparation Xiao et al., 2010, 2011
Xiao, J., et al. unpublished
“Assessing Ecosystem Carbon Dynamics over North America by Integrating Eddy Covariance, MODIS, and New Ecological Data through Upscaling and Model-data Synthesis”, NSF, $517,685, 2011-2014, Jingfeng Xiao (PI), Scott Ollinger (Co-PI).
Xiao et al., JGR, accepted