
SLIDE 1
1
BAT
T L E G ROUND
PUBL
IC SCHOOL S:
E nrollme nt F
- re c a st
Ana lysis
Sc hool Boa rd Pre se nta tion F e brua ry 12, 2018
- E. D. Hovee & Company, LLC
E c o no mic and Develo pment Servic es
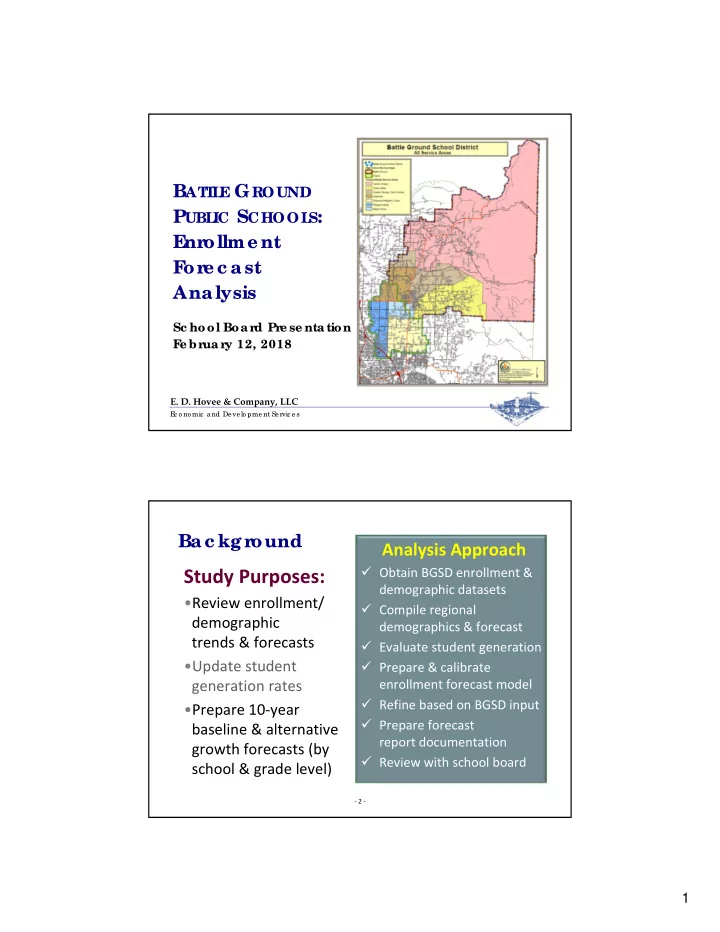
Ba c kg round
Study Purposes:
- Review enrollment/
demographic trends & forecasts
- Update student
generation rates
- Prepare 10‐year
baseline & alternative growth forecasts (by school & grade level)
‐ 2 ‐