
SLIDE 1
Structures and Implications for Flood Response in the Kromma Kill - - PowerPoint PPT Presentation
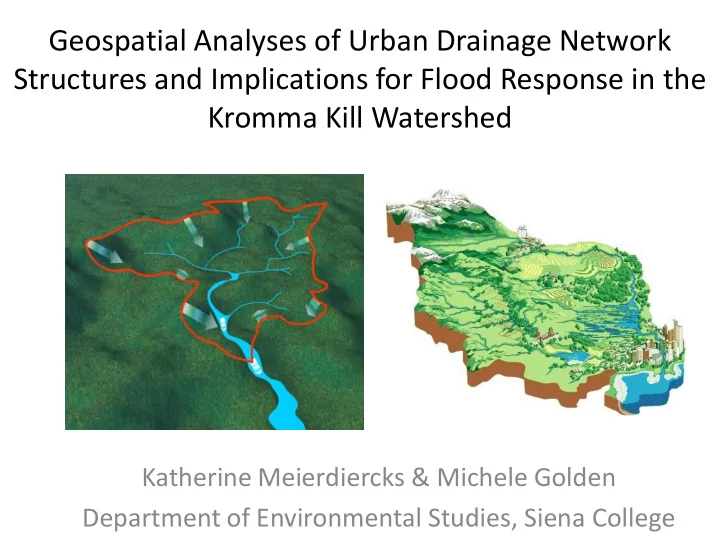
Geospatial Analyses of Urban Drainage Network Structures and Implications for Flood Response in the Kromma Kill Watershed Katherine Meierdiercks & Michele Golden Department of Environmental Studies, Siena College LINEAR V. NON-LINEAR
Gupta, 2010
! "#"$%
& ' () !* +,*- .!*/ / 0!1 23!' $4 5 !% 4 67829 #"
! !"!! # ! $ ! # ! $!"!! # % & ! # % &!"!! # ' % ! # ' % !"!( # ) ( # ) !"!) # &( * +, - ./0, +!1 2
7 82 9 : - 6 , 2 ; <, +!=8>3+- 2 ?
@ /..- 38A
CD D, 2 !E7 ?33; !F- ..; E7 ?33; !F- ..; !- 6 !: - ; </346 83
LINEAR V. NON-LINEAR RESPONSE ALONG A DRAINAGE NETWORK Can flood response be predicted from storm event magnitude and drainage area alone?
Meierdiercks et al., 2010
Runoff Coefficient = fraction of rainfall that becomes runoff
From Stream Corridor Restoration: Principles, Processes, and Practices (10/98). By the Federal Interagency Stream Restoration Working Group
QUESTIONS: (1) Can percent imperviousness explain heterogeneous flood response in the Kromma Kill and its subwatersheds? (2) Are there other geospatial characteristics that can be used to better predict flood response in the Kromma Kill and its subwatersheds?
Kromma Kill Watershed: 20 km2 Town of Colonie, Village of Menands Tributary to the Hudson River
y = 5.0719x1.8075 R² = 0.99 2 4 6 8 10 0.5 1 1.5 Q (cfs) Stage (feet)
New Hall Rating Curve
y = 0.4695x R² = 0.7122 0.5 1 1.5 0.5 1 1.5 2 Runoff (in) Rainfall (in)
East Hills “Average” Runoff Ratio
~35 rain events since 6/1/13 ~7.5 inches in June ~4.6 inches in July
Correlation Coefficient = 0.67
R² = 0.45296 0.1 0.2 0.3 0.4 0.5 0.6 10 20 30 "Average" Runoff Ratio Percent Impervious New Hall ARC North ARC South Lincoln Ave East Hills
R² = 0.4198 0.1 0.2 0.3 0.4 0.5 0.6 2 2.5 3 3.5 "Average" Runoff Ratio Slope (%) New Hall ARC North ARC South Lincoln Ave East Hills
Correlation Coefficient = 0.67
R² = 0.45296 0.1 0.2 0.3 0.4 0.5 0.6 10 20 30 "Average" Runoff Ratio Percent Impervious New Hall ARC North ARC South Lincoln Ave East Hills
Correlation Coefficient = 0.65
(Roy and Shuster, 2009)
(Mejía and Moglen, 2010)
Conclusions: The spatial distribution of impervious surfaces can impact peak magnitude and timing –
to delayed peak
Determine the probability that a rain drop with fall in an area draining into a stream of order ω and follow a path
Hypothesizes flood response can be predicted from the geomorphic properties of the drainage basin 7.4 and 7.5 Q (t) = i(τ) f(t-τ)dτ Q determined by multiplying the rainfall by the GIUH
RA= Ai+1/Ai Drainage-area ratio (the larger RA, the larger the drainage area
RL = Li+1/Li Length ratio (the larger RL, the longer higher order streams) Rb = Ni/Ni+1 Bifurcation ratio (the larger Rb, the “branchier” the watershed) L1 Average length of 1st order streams U Channel velocity
Rodriguez-Iturbe & Valdes, 1979
GEOMORPHIC PROPERTIES OF THE DRAINAGE BASIN
Rinaldo et al., 1995
R² = 0.9265 0.1 0.2 0.3 0.4 0.5 0.6 2 4 6 "Average" Runoff Ratio Area Ratio New Hall ARC North ARC South Lincoln Ave East Hills
Correlation Coefficient = 0.96 RA= Ai+1/Ai Drainage-area ratio (the larger RA, the larger the drainage area of higher order streams)
Michele Golden
This project is provided by the Principal Investigator (PI). Any opinions, findings, and conclusions or recommendations expressed in this presentation are those