Strengthening DCs Inclusionary Zoning DC Zonin ing g Comm mmiss - - PowerPoint PPT Presentation

strengthening dc s inclusionary zoning
SMART_READER_LITE
LIVE PREVIEW

Strengthening DCs Inclusionary Zoning DC Zonin ing g Comm mmiss - - PowerPoint PPT Presentation

Strengthening DCs Inclusionary Zoning DC Zonin ing g Comm mmiss ission Case e No No. 04-33G 33G DC Campaign for Inclusionary Zoning Cheryl Cort Coalition for Smarter Growth Claire Zippel DC Fiscal Policy Institute March 3, 2016


slide-1
SLIDE 1

1 February 26, 2013

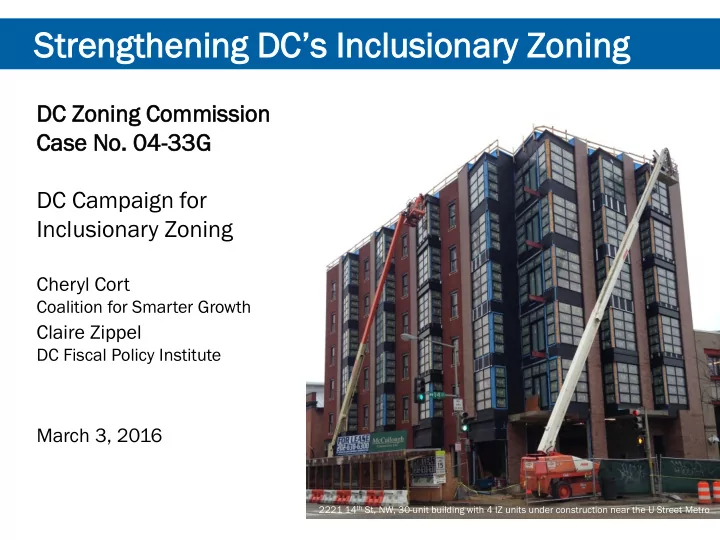
2221 14th St, NW, 30-unit building with 4 IZ units under construction near the U Street Metro

Strengthening DC’s Inclusionary Zoning

DC Zonin ing g Comm mmiss ission Case e No

  • No. 04-33G

33G DC Campaign for Inclusionary Zoning

Cheryl Cort

Coalition for Smarter Growth

Claire Zippel

DC Fiscal Policy Institute

March 3, 2016

slide-2
SLIDE 2

We Support Office of Planning Option 1B

 Rentals @ 60% MFI & Condos @ 80% MFI  Aligned with DC’s affordable housing needs  Consistent with national best practices  Value of existing bonus density largely offsets lower

rents

 Small impact on present land values

slide-3
SLIDE 3

 900 IZ units

produced or under construction

 25-year high in DC

residential construction last year

With Production Ramping Up, Time to Revisit

Sources: DC Office of Planning set-down and final reports on case no. 04-33G. New Private Housing Units Authorized By Building Permits in the District of Columbia, via Federal Reserve Bank of St. Louis.

200 400 600 800 1,000 1,200 1,400

2010 2011 2012 2013 2014 2015 Pipeline

Inclusi usionar

  • nary

y Zoning ng Un Units s

slide-4
SLIDE 4

Unique Tool in DC’s Affordable Housing Toolbox

 Affordable housing in

neighborhoods of

  • pportunity – access to

jobs, transit, good schools

 Affirmatively Furthering

Fair Housing

 Requires “proactive

steps” to reduce disparities in housing choice

slide-5
SLIDE 5

5

DC’s Affordable Housing Needs

slide-6
SLIDE 6

 Severe housing cost burden

 Half or more of income goes to pay for housing  Best measure of need in urban markets

 High housing costs especially tough on lower income

households’ ability to afford necessities

DC’s Affordable Housing Needs

slide-7
SLIDE 7

DC’s Affordable Housing Needs

Income Levels

Maximum Income MFI

1 person 2 people 3 people

50% $ 38,220 $ 43,680 $ 49,140 60% $ 45,860 $ 52,420 $ 58,970 70% $ 53,500 $ 61,150 $ 68,800 80% $ 61,150 $ 69,890 $ 78,620

Source: DC Code § 42–2801, Department of Housing and Urban Development Program Income Limits, 2015.

slide-8
SLIDE 8

DC’s Affordable Housing Needs

0% 5% 10% 15% 20% 25% 30% 35%

40-50% 50-60% 60-70% 70-80% 80-90% MFI

Percent of DC Households Severely Rent Burdened, By Income Level

Source: DCFPI analysis of 2013-2014 American Community Survey microdata.

slide-9
SLIDE 9

DC’s Affordable Housing Needs

  • 2,000

4,000 6,000 8,000 10,000 12,000

40-50% 50-60% 60-70% 70-80% 80-90% MFI

Number of DC Renter Households, By Rent Burden

Severely Rent Burdened (50% of Income) Moderately Rent Burdened (30 of Income) Not Rent Burdened

Source: DCFPI analysis of 2013-2014 American Community Survey microdata.

slide-10
SLIDE 10

Best Practices in IZ Income Targeting

Comparison of Inclusionary Zoning Programs Jurisdiction Targeted MFI Rental Ownership Region Montgomery County, MD 65% 70% Fairfax County, VA 50-65% 70% Na Nation Boston, MA 70%

  • Boulder, CO

60% 70% Cambridge, MA 65% 65% Chicago, IL 60% 100% San Diego, CA 65%

  • San Francisco, CA

55% 70-90% Santa Fe, NM 65%

  • Source: Urban Institute Affordable Housing Needs Assessment for the District of Columbia, Phase

I, 2015; Office of Planning Final Report for Case 04-44G, Technical Appendix, 26 Feb. 2016.

slide-11
SLIDE 11

IZ Produces Very Few Truly Affordable Rentals

Most IZ Units Are Moderate-Income Rentals

Percent of IZ units

Includes matter-of-right, PUDs, and subsidized affordable units that count for IZ compliance

Affordability Ownership Rental

Total

50% MFI 7.5% 4.8%

12.3%

80% MFI 10.2% 77.5%

87.7% Total 17.6% 82.4% 100.0%

Source: Office of Planning presentation to working group, Aug. 26, 2015.

slide-12
SLIDE 12

DC’s Affordable Housing Needs

 Very few 80% MFI households are severely rent

burdened

 Only 9 percent of renters 60-80% MFI are severely cost

burdened

 Compared to 24 percent of renters 40-60% MFI

Source: DCFPI analysis of 2013-2014 American Community Survey microdata.

slide-13
SLIDE 13

 Office of Planning: 80% MFI rental “very close to

available rental market supply”

 Urban Institute: “For low income [80% MFI]

households, we project a surplus of at least 4,300 affordable units” by 2020

 ¾ of lottery-registered households are at or below

60% MFI

 IZ program should serve more of these registered

households

DC’s Affordable Housing Needs

Sources: Urban Institute, Affordable Housing Needs Assessment for the District of Columbia, Phase II, 2015. Office of Planning set-down and final reports for case no. 04-33G.

slide-14
SLIDE 14

 Majority of IZ production would remain 80% MFI

units

 Extending 50%/80% MFI split to only 2 zones with high

development capacity, at 8% set aside

 2/3 of IZ production would be 80% MFI units, based on

current output

 Would not significantly increase opportunities for lottery-

registered households

 Freeze IZ rents

 Would not affect eligibility for units  Administrative change, rather than policy change

OP Final Recommendation

slide-15
SLIDE 15

15

Economic Impact of Option 1B

slide-16
SLIDE 16

 Bonus density created to offset cost of setting aside

affordable units

 Program has turned out to overcompensate

developments

 It’s time for the District to reclaim that windfall so we

can achieve deeper affordability

IZ Created Significant Value in Market

slide-17
SLIDE 17

IZ Created Significant Value in Market

Cumulative Impact To No-IZ Rental Market Zone Base IZ

Base IZ +

ZRR Parking

Base IZ + ZRR Parking +

Proposal 1B C2A

  • 0.4%
  • 0.4%
  • 4.0%

CR 18.9% 36.0% 16.6% C3A* 16.9% 31.5% 20.5% R5A

  • 5.4%
  • 5.4%

2.6%† R5D

  • 0.1%
  • 4.3%

C2B* 15.1%

  • 6.0%

R5B

  • 1.2%
  • 1.2%
  • 5.0%

C3C* 18.6% 34.1% 15.2% C2C* 2.7% 16.4% 0.9% W3* 18.9% 36.0% 16.6%

* Currently requires only 80% MFI units. † Reduce set-aside to greater of 8% of gross residential floor area or 50% of bonus density in R5A. Source: DCFPI analysis with Office of Planning residual land value impact model.

slide-18
SLIDE 18

Small Impact on Present Land Values

Cumulative Impact To Base IZ Rental Market Zone ZRR Parking

ZRR Parking +

Proposal 1B

ZRR Parking +

OP Proposal‡ C2A 0.0%

  • 3.6%
  • CR

14.4%

  • 1.9%
  • C3A*

12.5% 3.1% 7.2% R5A 0.0%

  • 0.6%
  • R5D
  • 4.7%
  • C2B*
  • 4.2%†
  • 4.5%

R5B 0.0%

  • 3.8%
  • C3C*

13.1%

  • 2.9%
  • C2C*

13.3%

  • 1.8%
  • W3*

14.4%

  • 1.9%
  • * Currently requires only 80% MFI units.

† Reduce set-aside to 7% of gross residential floor area in C2B. ‡ Require 50%/80% MFI unit split, and reduce set aside to 8% of gross residential floor area in C3A

C2B, and SP1 (not shown). Source: DCFPI analysis with Office of Planning residual land value impact model.

slide-19
SLIDE 19

Modifications to Proposal 1B

 Equalize new requirements with value of bonus density

 R5A - Reduce set-aside to greater of 8% gross residential

floor area or 50% of bonus density (from 10%/75%)

 Reduce impact to present land value

 C3B - Reduce set-aside to 7% of gross residential floor area

(from 8%/50%)

slide-20
SLIDE 20

 Splitting income targeting by tenure unlikely to

damper strong rental market

 10,000 new Class A rentals planned for DC by 2018

 Project-unique impacts of new requirements can be

addressed through:

 Projects in the pipeline to comply with current

requirements

 BZA relief

Marginal Impact on Present Land Values

Source: Delta Associates Multifamily Market Overview, 2015.

slide-21
SLIDE 21

Comments on Other OP Proposals

slide-22
SLIDE 22

Comments on Other OP Proposals

 Matter-of-right off-site

 Increase in affordable space should be 50% rather than

20%

 Consider administrative approval of off-site location to

ensure fair housing

 Clarify that Mayor may purchase units to rent, as well as

to buy

 Vague flexibility risks loss of affordable units

slide-23
SLIDE 23

Comments on Other OP Proposals

 All increases in FAR should be treated as bonus density

for determining IZ requirements

 Including increases provided by BZA, text amendments, and

Comprehensive Plan