
SLIDE 1
1 F e b rua ry 26, 2013
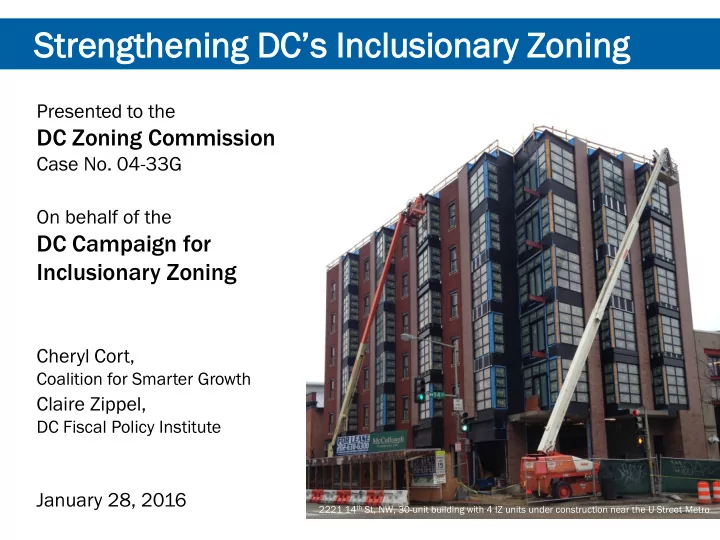
2221 14th St, NW, 30-unit building with 4 IZ units under construction near the U Street Metro
Streng ngthenin ning D DCs Incl clus usio iona nary Z Zoning - - PowerPoint PPT Presentation
Streng ngthenin ning D DCs Incl clus usio iona nary Z Zoning ng Presented to the DC Zoning Commission Case No. 04-33G On behalf of the DC Campaign for Inclusionary Zoning Cheryl Cort, Coalition for Smarter Growth Claire Zippel,
1 F e b rua ry 26, 2013
2221 14th St, NW, 30-unit building with 4 IZ units under construction near the U Street Metro
From: Urban Institute Affordable Housing Needs Assessment: Phase 1, 2014
Source: DC Office of Planning set-down report on case no. 04-33G. Includes IZ units in matter-of right developments, PUDs, and subsidized affordable developments.
50 100 150 200 250 300
2010 2011 2012 2013 2014 2015 In Pipeline
IZ units produced or in pipeline, IZ-compliant developments
Percent of IZ units
Includes matter-of-right, PUDs, and subsidized affordable units that count for IZ compliance
Affordability Ownership Rental
Total
50% AMI 7.5% 4.8%
12.3%
80% AMI 10.2% 77.5%
87.7% Total 17.6% 82.4% 100.0%
Source: IZ-compliant production with filed Notices of Availability as of June 2015, DC Office of Planning set-down report on case no. 04-33G.
Residential zones All other zones Low density zones / Stick construction Higher set-aside Split between 50% & 80% AMI Split between 50% & 80% AMI High density zones / Steel construction Lower set-aside Split between 50% & 80% AMI All 80% AMI
Source: 11 DCMR 2603. Higher set-aside: Greater of 10% residential FAR or 75% bonus
Income Level Maximum Income
2- person household
Severely Rent Burdened Households Share Number 50-60% AMI $52,400 16.3% 1,660 70-80% AMI $69,900 5.2% 311
Source: DCFPI analysis of 2014-2013 American Community Survey. Margin of error: 50-60% AMI: ±0.7%; 70-80% AMI: ±0.5%.
Income Level Maximum Income
2- person household
Sample Occupations 60% AMI $52,400
Administrative assistant Retail & food preparation supervisor School bus driver Maintenance worker
80% AMI $69,900
Legal support worker Educational counselor Sales representative Internist (M.D.)
Source: DC Code § 42–2801; US Bureau of Labor Statistics, Occupational and Employment Statistics for the District of Columbia, 2014.
Sources: Comments by DHCD IZ & ADU Program Director at DC Office of Planning working group, Aug. 13, 2015; 2015 DHCD IZ Maximum Rent and Purchase Price Schedule; DC Office of Planning set-down report on case no. 04-33G.
11 F e b rua ry 26, 2013
Zones are in order of by development capacity as determined by OP study
Impact on Market Zone Income Targeting Change Current IZ Scenario 1B Modified Scenario 1B
C-2-A 65-60
3.9% CR 80-60 18.4% 15.5% C-3-A 80-60 16.5% 20.6% R-5-A 65-60
R-5-D 65-60
0.0% C-2-B 80-60 14.6% 4.5% R-5-B 65-60
3.2% C-3-C 80-60 18.1% 13.8% C-2-C 80-60
W-3 80-60 18.4%
5.5%
Zone Impact to Market Base IZ Scenario 1B Modified Scenario 1B Modified set-aside C2A
3.9% 8%/50% R5A
R5B
3.2% R5C 6.8% 4.2% R5D
0.0% 7%/40% W1
3.9% 8%/50% C2B 7.0% 4.5% C2C
C3A 7.1% 20.6% C3B 7.2% 4.7% C3C 0.3% 13.8% CR 0.0% 15.5% CR/FT 1.3%
SP1 7.1% 4.6% SP2
W2 9.6% 7.1% W3 0.0%
6% 7%/40%