Mon Monda day, , No Novemb ember 18 er 18, , 20 2019 19 - - PowerPoint PPT Presentation

mon monda day no novemb ember 18 er 18 20 2019 19
SMART_READER_LITE
LIVE PREVIEW

Mon Monda day, , No Novemb ember 18 er 18, , 20 2019 19 - - PowerPoint PPT Presentation

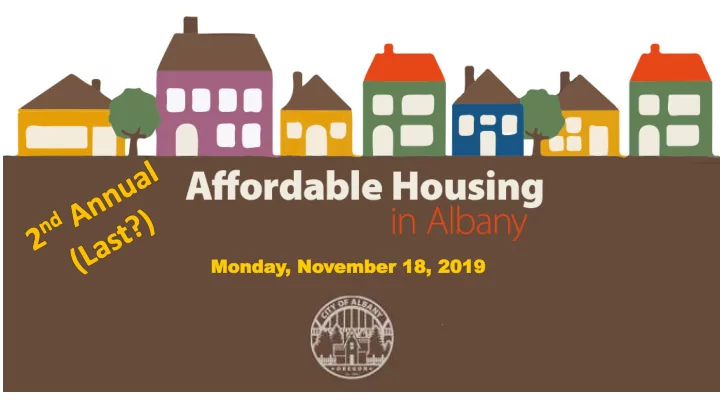
Mon Monda day, , No Novemb ember 18 er 18, , 20 2019 19 House Bill 4006 adopted in 2018 requires cities to track affordable housing development and Why cities over 10,000 people with severe rent Were burden to hold a public meeting


slide-1
SLIDE 1

Mon Monda day, , No Novemb ember 18 er 18, , 20 2019 19

slide-2
SLIDE 2

Why We’re Here

House Bill 4006 adopted in 2018 requires cities to track affordable housing development and cities over 10,000 people with severe rent burden to hold a public meeting to discuss:

Severe Cost/Rent Burden: when a household spends more than 50%

  • f household income on for housing costs (rent, mortgage, utilities).

Housing Cost/Rent Burden: when a household spends more than 30%

  • f household income on housing costs
slide-3
SLIDE 3

HB 4006 & Severe Rent Burden Cities > 25,000

Albany is 1 of 14 severe rent burdened cities over 25,000 people

slide-4
SLIDE 4

85% 81% 52% 36% 5% 74% 43% 8% 4% 1% 0% 10% 20% 30% 40% 50% 60% 70% 80% 90%

<= 30% AMI, Extremely Low 30%-50% AMI, Very Low 50%-80% AMI, Low 80%-100% AMI, Moderate >100% AMI

Cost Burden By Income (All Albany Households)

Cost Burden > 30% Cost Burden > 50%

slide-5
SLIDE 5

86% 68% 44% 43% 6% 71% 34% 15% 2% 1%

0% 10% 20% 30% 40% 50% 60% 70% 80% 90% 100%

<= 30% AMI, Extremely Low 30%-50% AMI, Very Low 50%-80% AMI, Low 80%-100% AMI, Moderate >100% AMI

Owner Cost Burden by Income

84% 86% 60% 21% 2% 74% 47% 2% 8% 0%

0% 20% 40% 60% 80% 100% <= 30% AMI, Extremely Low 30%-50% AMI, Very Low 50%-80% AMI, Low 80%-100% AMI, Moderate >100% AMI

Renter Cost Burden by Income

Cost Burden > 30% Cost Burden > 50%

Housing Cost Burden Albany Households

1235 830 965 1535 1400 285 255 700 230 565

slide-6
SLIDE 6

$557 $661 $878 $1,278 $1,491

$646 $761 $1,006 $1,453 $1,663

16% 15% 15% 14% 12%

$- $200 $400 $600 $800 $1,000 $1,200 $1,400 $1,600 $1,800 Efficiency 1-Bedr 2-Bedr 3-Bedr 4-Bedr

Fair Market Rents 15% 2017 – 2019

2017 2019 % Increase 2017 to 2019

Income Needed: $25,840 $30,440

$40,240 $58,120 $66,520

Market Rents: $615-$725 $825-$1,114 $800-$1,314 $975-$1,995 $2,100-$2995

slide-7
SLIDE 7

4,198 HHs can afford less than $625/month

$625 - $875/month $875-$1,275 /month

slide-8
SLIDE 8

Year Median Income 2-Bedr Fair Mkt Rent Average home price (Linn Co.) Average Price/SF 2015 $56,200 $801 $196,380 $122 2016 $53,600 $830 $217,761 $135 2017 $55,100 $878 $271,663 $159 2018 $59,700 $916 $299,333 $169 2019 $68,600 $1,006 $320,141 $185

% Change 2015-2018

6.2% 14.4% 52.4% 38.5%

% Change 2015-2019

22% 26% 63% 52%

Household income of $80,000/yr to afford $2,000 monthly payment

(10% down, 4.0% interest rate)

Causes of Rent Burden?

  • Housing costs are increasing faster than incomes.
slide-9
SLIDE 9

Causes of Rent Burden?

Low vacancy rates → increased demand = Rapid increase in rents Lack of affordable housing – 535 regulated long-term affordable units Mismatch between housing needs (types, size, price) & housing stock Other Causes?

slide-10
SLIDE 10

1 BEDR, 411, 59% 2 BEDR, 213, 30% 3 BEDR, 67, 10% 4 BEDR, 6, 1%

698 Albany Households on Voucher Waiting List

Linn Benton Housing Authority Housing Programs

Section 8 Housing Choice Vouchers, Affordable Senior Housing

78% 18% 4%

Incomes of Households on Wait List

<30% of Median 30-50% of Median 50-80% of Median

295 350 553 715

100 200 300 400 500 600 700 800

ELDERLY HOUSEHOLDS FAMILIES WITH CHILDREN DISABLED FEMALE HEAD

Albany Households with Vouchers (958, 1874 people)

slide-11
SLIDE 11

Community Community Serv Service ice Con Consortium sortium Housing Assistance Provided 12 months

417 Albany households requested housing assistance between September 2018 and September 2019 for:

  • Homeless Prevention Requests: 147 of 356

households were served with eviction prevention (74%) and households doubled-up with friends and family (26%).

  • Housing for Homeless Requests: 35 of 61 homeless

households were housed. Reasons for denial: unable to find housing within fair market rent limits, client over income limit, no way to sustain housing, client not at risk, program out of funds

slide-12
SLIDE 12

Consequences of Severe Rent Burden?

  • Increased homelessness - 181 sheltered and 75 unsheltered in 2019.
  • Increase housing insecurity – children, single-parents, elderly, persons

with disabilities, veterans, minorities, and those substance abuse and mental health issues

  • Increased mobility → disruption in student learning and development;
  • Increased need for social services and safety net programs
  • Reduced ability to make healthy choices (childcare, safe vehicles, healthy

food, healthcare, clothing, etc.)

  • Can lose job – if health or transportation issues
  • Little to no savings → Reduced home ownership rates → decreased asset

building and wealth creation

  • Unable to move up to market rate housing → lower turnover in

affordable housing developments

slide-13
SLIDE 13

Barriers Barriers to to Affordable Affordable Housing / Housing / Reducin Reducing g Rent Rent Burden? Burden?

slide-14
SLIDE 14

Incentives for Affordable Housing

  • Land use tools - Reduced parking, inclusionary zoning
  • Deferred SDCs or waived (if paid by other funding source)
  • Tax abatement – state laws
  • Property Donations and Land Banking
  • Grants/loans – CDBG, urban renewal, housing fund (local, revenue source needed)

Solutions to Reducing Rent Burden?

Affordable Housing Production Revenue Sources

  • Construction excise tax - up to 1% on value of new construction; 50% minimum to

developer incentives, 15% to OHCS, and 35% for local affordable housing programs (Corvallis, Newport, Lincoln City, Eugene, Portland, Cannon Beach, Medford, Milwaukie)

  • State and Federal $ – tax credits, other programs
  • CDBG – acquisition or qualified Community Development Based Organization
  • Urban Renewal
slide-15
SLIDE 15

Solutions to Reducing Rent Burden

Land Use Standards & Zoning

  • Code Audit - Clear and Objective standards updates, affordable housing

density bonus revisions (IN PROGRESS)

  • Evaluate Parking Standards (DONE, no changes recommended)

Evaluate Other Efficiencies:

  • Minimum densities
  • Height and lot coverage
  • Less parking for affordable housing
  • Other?

Process Efficiencies

  • Online permitting (DONE)
  • Expedited land use review for affordable multi-family housing (DONE)
  • Other?

Housing Opportunities

  • Accessory dwelling units (ALLOWED & UPDATING IN PROGRESS)
  • HB 2001 – will require duplexes where single-family allowed, and City to

consider where to permit 3-4 plexes, cottage clusters, townhouses (by 6/30/2022)

slide-16
SLIDE 16

City City sup suppor port for t for Afford Affordable able Housing Housing

  • Surplus property donations

(Habitat, Albany Partnership)

  • Urban Renewal $ for

affordable housing (Riverview Place, Woodwind apartments)

  • CDBG - infrastructure for

Habitat and Albany Partnership

  • CDBG loans and grants for

low-mod housing rehabilitation

  • CDBG $ for property

acquisition for affordable housing

  • CDBG – down payment

assistance (via DevNW, LBHA)

  • CDBG grants for emergency

housing assistance (via CSC)

City is funding:

  • Housing Needs Analysis &

Buildable Lands Inventory

  • Economic Opportunities

Analysis (April 2020)

City received grant $ to:

  • Develop East Albany

Refinement Plan (2020-2021)

Other City Actions

slide-17
SLIDE 17

Other T Other Though houghts, Concer ts, Concerns, S ns, Stories? tories?

Thank you for coming! Questions? Make sure you signed in!

slide-18
SLIDE 18

2019 HUD Calculated Income Limits by Household Size Albany MSA (Linn County)

1 2 3 4 5 6 7 8 Extremely Low income (< 30% of median) $13,800 $15,800 $17,750 $19,700 $21,300 $22,900 $24,450 $26,050 Very Low income (30% -50% of median) $23,000 $26,250 $29,550 $32,800 $35,450 $38,050 $40,070 $43,300 Low income (50%-80% of median) $36,750 $42,000 $47,250 $52,500 $56,700 $60,900 $65,100 $69,300