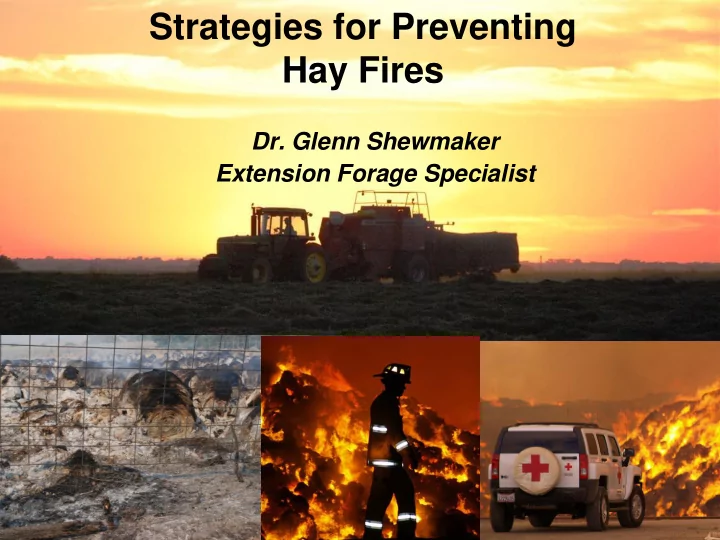
Strategies for Preventing Hay Fires Dr. Glenn Shewmaker Extension - - PowerPoint PPT Presentation

strategies for preventing
SMART_READER_LITE
LIVE PREVIEW

Strategies for Preventing Hay Fires Dr. Glenn Shewmaker Extension - - PowerPoint PPT Presentation

Strategies for Preventing Hay Fires Dr. Glenn Shewmaker Extension Forage Specialist OBJECTIVES Describe forage moisture Process of plant and microbial respiration Review how to sample and estimate forage moisture in the windrow,


slide-1
SLIDE 1

Strategies for Preventing Hay Fires

  • Dr. Glenn Shewmaker

Extension Forage Specialist

slide-2
SLIDE 2
slide-3
SLIDE 3
slide-4
SLIDE 4

OBJECTIVES

  • Describe forage moisture
  • Process of plant and microbial respiration
  • Review how to sample and estimate forage

moisture in the windrow, bale, and stack

  • 11 Steps to prevent hay fires
  • Reduce everyone’s risk of hay fires

“No one wins in a hay fire!”

slide-5
SLIDE 5

Hay Moisture

  • Stem moisture remains in the plant stem

during the curing process.

– Windrowed hay, given ample time to field-dry, will eventually dissipate stem moisture.

  • Dew moisture on the outer surface of the

stem and leaf is caused by the relative humidity and condensation.

– Dew moisture is rapidly removed by sunlight or a light breeze and usually only remains for a few hours each day.

slide-6
SLIDE 6

Microbial Respiration

  • Microbial growth uses the carbohydrates as a

source of energy

  • Converts carbohydrates and oxygen into

carbon dioxide, water and heat

slide-7
SLIDE 7

Large bales are susceptible to greater storage losses and risk of spontaneous heating than small bales formed at the same moisture. Large bales

  • Higher density
  • More volume
  • Less vapor routes

Small bales

slide-8
SLIDE 8

Bale Characteristics

Characteristic Small 3-string Mid-size Large Round End size (in) 14 x 18 15 x 22 32 x 32 48 x 48 72 Length (in) 38 44 96 96 60 Volume (ft3) 5.5 8.4 56 112 141 Weight (lb) 60 130 900 1800 1900 Density (lb/ft3) 8-11 15 14-16 14-16 10-13 Max moisture (%) 20 18 16 15 18

slide-9
SLIDE 9

Heating

  • All hay baled at moisture contents above 15

% will undergo some elevation in temperature in the first 1-3 weeks following baling.

  • “Sweating”
  • Due to plant respiration and microbial activity.
  • Hay at 15 to 20 % moisture content will heat

enough to cause measurable dry matter losses (4 to 5 %).

slide-10
SLIDE 10

Normal Heating in Baled Hay

  • Sugars are respired to yield carbon dioxide, water, and

heat.

  • Temperature may reach 100 degrees F or higher.
slide-11
SLIDE 11

Secondary Storage Heating Hay

  • Microorganisms continue to respire and heat accumulates

faster than it dissipates.

  • Temperature may reach 160-170 degrees F.
slide-12
SLIDE 12

Exothermic Heating

  • O2 combines with highly oxidizable material produced during

secondary heating.

  • Temperature will rise to the kindling point if enough O2 and

moisture are present to generate heat faster than it escapes.

  • Process starts at about 130oF and may reach 190oF when

the situation becomes critical.

slide-13
SLIDE 13
  • Since heat movement in dry hay is slower

than in moist hay, the movement of heat from the center to the outside of the bale slows down as the surface layers begin to dry.

  • This causes the internal bale temperatures to

increase rapidly after much of the surface moisture appears to have been removed.

slide-14
SLIDE 14

Spontaneous Combustion

  • Caused when respiration and microbial

heating raise temperatures greater than 170°F.

  • However, when spontaneous combustion
  • ccurs, it does not originate in the center of

the bale, but nearer the outside, because

  • xygen levels in the middle of the bale are

usually too low for combustion to occur.

slide-15
SLIDE 15
slide-16
SLIDE 16

46% ADF 28% ADF

slide-17
SLIDE 17

Steps to Reduce Hay Fires I

  • 1. Record day of cutting and drying conditions

in a journal.

  • 2. Monitor windrow hay moisture prior to

raking, tedding, and baling

a) Use a tactile (feel) method to evaluate hay moisture b) Use a windrow moisture device appropriate to simulate the bale density that electronic moisture probes are designed for

slide-18
SLIDE 18

Measuring Moisture

  • 12 samples may be

adequate in forage with uniform dryness

slide-19
SLIDE 19
slide-20
SLIDE 20

Windrow compaction tool

slide-21
SLIDE 21

The compaction tool simulates the density of a large bale

slide-22
SLIDE 22

Sample size Typical error (grams) (%) Microwave oven 50-200 5-15 minutes

  • 2 to +1

Electronic probe Bale or windrow 1 minute ±5 Convection oven 10-1,000 5 hours – 3days ±1 NIRS 0-40 1 hour ±3 Method Testing time

slide-23
SLIDE 23

Steps to Reduce Hay Fires II

  • 3. Record the day of raking, tedding, inversion,

and baling and drying conditions.

  • 4. Test first 3 bales from a field with a hand-

held electronic moisture probe in 2 places on each side or end of bale (total 12 readings) and note the low, high, and average.

– If the average moisture is below the maximum for the type of bale and forage, continue baling.

slide-24
SLIDE 24

Steps to Reduce Hay Fires III

  • 5. Observe the baler moisture meter if

available, and/or the bale pressure indicator: when anything changes, get out and retest more bales as in #4

  • 6. Record date, time, weather conditions, and

moisture average and range in your journal

slide-25
SLIDE 25

Steps to Reduce Hay Fires IV

  • 7. Mark any bales with higher moisture than

desired, and notify the person stacking the hay to place those bales separate from the dry bales with space between bales to facilitate air movement and drying. Try to feed these bales as soon as possible.

  • Do not store any bales with moisture over the

recommended level for the type of bale in a large stack or hay shed!

slide-26
SLIDE 26

Steps to Reduce Hay Fires V

  • 8. Review and comply with your carrier’s

requirements for fire insurance coverage.

Photo from Kittitas Co Fire Marshall

slide-27
SLIDE 27

Steps to Reduce Hay Fires VI

  • 9. If moisture is marginal, stack the bales in a

single column with no more than 500 tons per stack with at least 100 feet of separation to another stack.

– Layout the stack so it can be quickly broken apart with a loader. – Avoid mixing different lots of hay – Monitor the moisture and temperature, if the moisture is marginal, in the stack at about 20 random or systematic locations.

slide-28
SLIDE 28

Steps to Reduce Hay Fires VI

  • 10. Obtain a bale core sample, double sack the

core sample in 2 zip-lock plastic bags, and submit it to a NFTA certified lab for moisture and forage quality analysis.

slide-29
SLIDE 29

Steps to Reduce Hay Fires VII

11.Protect the stored hay from external weather and water flow by elevating the base and having adequate rain gutters to direct flow of water away from the stack.

slide-30
SLIDE 30

Problem: Moisture Sampling in the Stack

slide-31
SLIDE 31

5 10 15 20 25 30 35 40 5 10 15 20 25 30 Reading Farmex probe moisture, %

2 3 4 5 6 7 8

Sequential Moisture in 1-ton Bales

slide-32
SLIDE 32

CONCLUSIONS

  • Monitor forage moisture in the windrow, bale,

and stack or silo.

  • Moisture is not usually uniform.

– Mark high moisture bales and feed soon!

  • Monitor bale temperature.
  • Stack hay so moisture can escape, and you

don’t burn up the whole thing!

slide-33
SLIDE 33

CONCLUSIONS

  • Drying ovens and NIR instruments tend to be

more accurate than electronic conductance moisture testers

  • Results can be affected by many factors
  • The electronic probe is not a "magic box", but

a tool to estimate moisture.

slide-34
SLIDE 34

CONCLUSIONS

  • Take Numerous Random Samples (12-20)
  • The electronic probe has the advantage of

allowing for many samples done quickly.

  • A basic protocol should be followed, but in

the end, each farmer uses the moisture tester, based on his own experience, to produce quality hay with the management and equipment he uses.

slide-35
SLIDE 35
slide-36
SLIDE 36
slide-37
SLIDE 37