Strategic Map 1 2 3 4 5 So, what is next? How do these - - PowerPoint PPT Presentation

strategic map
SMART_READER_LITE
LIVE PREVIEW

Strategic Map 1 2 3 4 5 So, what is next? How do these - - PowerPoint PPT Presentation

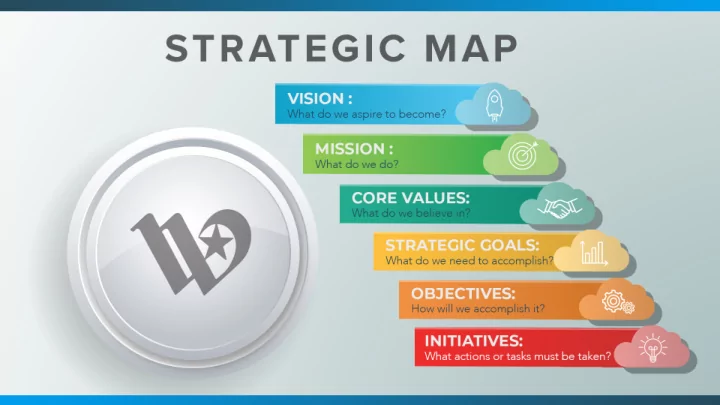
Strategic Map 1 2 3 4 5 So, what is next? How do these elements link to the budget and to activities? How do we track progress and know if we are moving towards a goal or away from it? The answer to these


slide-1
SLIDE 1

1

Strategic Map

slide-2
SLIDE 2

2

slide-3
SLIDE 3

3

slide-4
SLIDE 4

4

slide-5
SLIDE 5

5

slide-6
SLIDE 6

6

  • So, what is next?
  • How

do these elements link to the budget and to activities?

  • How do we track progress and know if

we are moving towards a goal or away from it?

  • The answer to these questions lies in

developing appropriate

  • bjectives,

initiatives, and performance targets.

slide-7
SLIDE 7

7

Management Policy

slide-8
SLIDE 8

Recommended Approach

  • 1. Work with department staff to develop a small

number of objectives and performance measurements for each goal.

  • 2. Not about being adversarial or “gotcha mentality”
  • 3. We can’t be afraid of bad news
  • 4. Build-up an organizational culture of follow-up and

regular check-ins.

  • 5. Help our team move to outcome-based performance

management.

  • 6. Create an online performance management report for

City Council and the public during FY 2020/2021

slide-9
SLIDE 9

Strategic Goal Safe and Vibrant City

Initiatives

  • Improve data analysis of animal intakes and
  • utcomes
  • Hire and retain at least one veterinarian

Performance Indicators

  • Monthly Live-Exit rate greater than 90%
  • Ensure daily occupancy rate at the shelter

remains below __%

Animal Services Objective

Maintain a best-in-class animal welfare facility that is focused on positive outcomes for the animals and people.

slide-10
SLIDE 10

10

slide-11
SLIDE 11

11

slide-12
SLIDE 12

12 Occupancy Rate

slide-13
SLIDE 13

Recommended Approach

  • 1. Work with department staff to develop a small

number of objectives and performance measurements for each goal.

  • 2. Not about being adversarial or “gotcha mentality”
  • 3. We can’t be afraid of bad news
  • 4. Build-up an organizational culture of follow-up and

regular check-ins.

  • 5. Help our team move to outcome-based performance

management.

  • 6. Create an online performance management report for

City Council and the public during FY 2020/2021

13

slide-14
SLIDE 14

General Fund Financial Update

Paul Cain, Assistant City Manager April 14, 2020

14

slide-15
SLIDE 15

Agenda

  • FY2020 Trend Prior to COVID-19
  • COVID-19 Assumptions and Financial Impact
  • General Fund Balance and Assignments
  • Bond Rating View
  • FY2021 Budget Strategy
  • General Debt Capacity
  • Council Priorities

15

slide-16
SLIDE 16

FY2020 Trend Prior to COVID-19

16

39.5 21.5 43.1 5 10 15 20 25 30 35 40 45 50

Sales Tax

FY20 Budget YTD Collections Projection Prior To COVID-19 *In Millions

Revenues: Increase of $3.6 M Sales Tax Collections Expenses: $2.2 M Savings Fund Balance: $5.8 M Increase to Offset the Budgeted Drawdown $15.75 M (FY20 Original Budgeted Drawdown $4.40 M + Approved Additional Drawdown $11.35 M)

slide-17
SLIDE 17

COVID-19 Assumptions and Financial Impact

“Rapid Resolution” Assumptions

  • Economy will have the largest negative financial impact in April-May (e.g. ST down 35%)
  • Economy will begin to slightly bounce back in June (e.g. ST down 20%)
  • Economy will begin to stabilize in July and thereafter (e.g. ST down 15%)

“Slower Resolution” Assumptions

  • Economy will have large lasting negative financial impacts through reminder of fiscal

year (e.g. ST down 60% for remainder of year) Tools and sources utilized

  • ZacTax
  • News Outlets
  • Finance Department Analysis
  • Financial Advisor
  • Other Cities

17

slide-18
SLIDE 18

COVID-19 Assumptions and Financial Impact

General Fund Revenues: COVID-19 Impact

18

Rapid Resolution Projection ($5.61 M) Slower Resolution Projection ($11.77 M)

slide-19
SLIDE 19

COVID-19 Assumptions and Financial Impact

General Fund Expenses: COVID-19 Impact

19

Rapid Resolution Projection $3.60 M (Savings) Slower Resolution Projection $1.91 M (Savings)

slide-20
SLIDE 20

General Fund Balance (FB)

20

Rapid Resolution Projection Additional FB: ($2.01 M) Net Change to FB: ($0.61 M) Slower Resolution Projection Additional FB: ($9.86 M) Net Change to FB: ($5.86 M)

slide-21
SLIDE 21

General Fund Balance (FB) & Assignments

21

FY20 Fund Balance Drawdown $25.35 M

slide-22
SLIDE 22

FY20 $25.35M Drawdown by Category

22

Capital Assignments $15M

slide-23
SLIDE 23

General Fund Balance & Assignments

23

With COVID-19 Fund Balance Drawdown

slide-24
SLIDE 24

FY2021 Budget Strategy

24

  • Only base adjustment requests submitted
  • Recurring and one-time requests excluded
  • dependent on status of pandemic response/recovery
slide-25
SLIDE 25

General Debt Review

25

Bond Capacity

  • Taxable Assessed Value (TAV) 5 Year Historical Average: 7.58%
  • Projecting FY20-21 3% Growth
  • Debt Capacity Dependent on TAV, interest rates, ability to shift rate from

O&M to DS (status of operating revenue)

slide-26
SLIDE 26

FY 19-20 Council Priorities

26

  • Infrastructure
  • Compensation
  • Benefits
  • Public Safety
  • Code Enforcement
  • Strategic Economic Development
  • Equitable Practices
slide-27
SLIDE 27

Questions

27

slide-28
SLIDE 28

City of Waco Veterans Day Holiday

Missie Pustejovsky, HR Director April 14, 2020

28

slide-29
SLIDE 29

City of Waco Focus Group

  • 10 cross department focus groups
  • 12/16/19 – 1/6/20
  • 76 (5% employee population) participated
  • Feedback regarding future at the City of Waco
  • Observance of Veterans Day suggested

29

slide-30
SLIDE 30

Veterans Day

City of Waco observes 10 holidays

New Year's Day MLK Day Spring Holiday Memorial Day Independence Day Labor Day Thanksgiving Day Day After Thanksgiving Christmas Eve Christmas Day

Peer Cities

  • 9 of 11 peer cities observe 11 or more holidays
  • 6 of 11 Peer Cities observe Veterans Day

30

slide-31
SLIDE 31

Waco History

Rich Field Camp McArthur James Connally Air Force Base Freedom Fountain Doris Miller VA Medical Center

31

slide-32
SLIDE 32

Waco Convention Center Visitors Bureau Governance Update

Deidra Emerson, Assistant City Manager April 14, 2020

32

slide-33
SLIDE 33
  • Process Background
  • Model Recommendations
  • Actions to Date
  • Next Steps

Presentation Overview

33

slide-34
SLIDE 34
  • 2015 - Jones, Lang, LaSalle (JLL), engaged to perform

marketing and operational assessment of WCC and CVB

  • 2016 – JLL conducted stakeholder interviews and worked

with the task force on governance options

Process Background

34

slide-35
SLIDE 35
  • 2017 – JLL presented final report and recommendations
  • 2018 – City Council dissolved the Advisory Board and

created the Waco Convention Center and Visitors Bureau Commission

Process Background

35

slide-36
SLIDE 36
  • Option 1:

– Non-Profit Organization for CVB with publicly managed Convention Center

  • Option 2:

– Non-Profit Organization for CVB with privately managed Convention Center

  • Option 3:

– Current Model with enhanced Advisory Board

Model Recommendations

36

slide-37
SLIDE 37
  • Creation of Waco Convention Center and Visitors Bureau

Commission

  • Revised Booking Policy
  • Developed SOPs
  • Enhanced Marketing Efforts
  • Developed a Capital Plan
  • Reviewed Pay Structure

Actions to Date

37

slide-38
SLIDE 38
  • Finalize Food and Beverage Policy
  • Finalize Pay Structure

– Incentive Pay

  • Finalize Operational Policies and Procedures

Next Steps

38

slide-39
SLIDE 39

Questions?

Waco Convention Center and Visitors Bureau Governance Update Deidra Emerson

39

slide-40
SLIDE 40

National League of Cities Service Line Warranty Program

Ashley Nystrom, Executive Coordinator April 14, 2020

40

slide-41
SLIDE 41

NLC Service Line Warranty Program

  • Repair and replacement plans for private side water

and sewer lines, including interior plumbing

  • Administered by Utility Service Partners, a HomeServe

Company

  • No cost to the City
  • Some staff time involved, twice a year campaigns
  • Company would like to utilize City endorsement on
  • utreach/marketing materials
  • Some Cities participate in revenue sharing

41

slide-42
SLIDE 42

NLC Service Line Warranty Program

  • References from participating Texas cities
  • San Angelo
  • Killeen
  • Lancaster
  • Bryan
  • Midland
  • Texarkana
  • Waxahachie

42

slide-43
SLIDE 43

Questions

43