
SLIDE 1
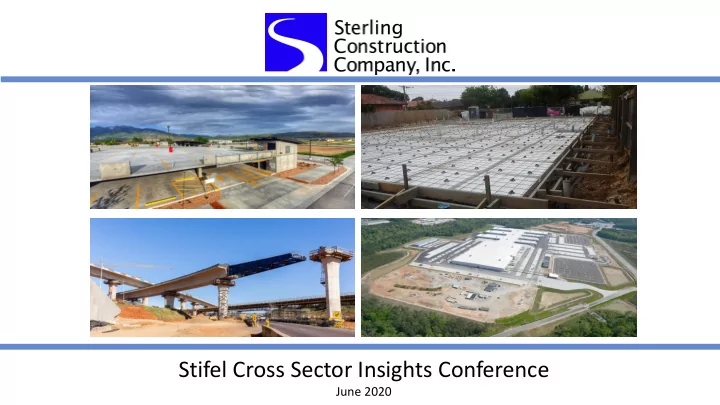
Stifel Cross Sector Insights Conference
June 2020
Stifel Cross Sector Insights Conference June 2020 Disclosure: - - PowerPoint PPT Presentation
Stifel Cross Sector Insights Conference June 2020 Disclosure: Forward-Looking Statements This presentation contains, and the officers and directors of the Company may from time to time make, statements that are considered forward looking
June 2020
2 This presentation contains, and the officers and directors of the Company may from time to time make, statements that are considered forward–looking statements within the meaning of the Securities Act of 1933 and the Securities Exchange Act of
control, which may include statements about our: business strategy; financial strategy; and plans, objectives, expectations, forecasts, outlook and intentions. All of these types of statements, other than statements of historical fact included in this presentation, are forward-looking statements. In some cases, forward-looking statements can be identified by terminology such as “may,” “will,” “could,” “should,” “expect,” “plan,” “project,” “intend,” “anticipate,” “believe,” “estimate,” “predict,” “potential,” “pursue,” “target,” “continue,” the negative of such terms or other comparable terminology. The forward-looking statements contained in this presentation are largely based on our expectations, which reflect estimates and assumptions made by our management. These estimates and assumptions reflect our best judgment based on currently known market conditions and other factors. Although we believe such estimates and assumptions to be reasonable, they are inherently uncertain and involve a number of risks and uncertainties that are beyond our control. In addition, management’s assumptions about future events may prove to be inaccurate. Management cautions all readers that the forward-looking statements contained in this presentation are not guarantees of future performance, and we cannot assure any reader that such statements will be realized or the forward-looking events and circumstances will occur. Actual results may differ materially from those anticipated or implied in the forward- looking statements due to factors listed in the “Risk Factors” section in our filings with the U.S. Securities and Exchange Commission (“SEC”) and elsewhere in those filings. The forward- looking statements speak only as of the date made, and other than as required by law, we do not intend to publicly update or revise any forward-looking statements as a result of new information, future events or otherwise. These cautionary statements qualify all forward-looking statements attributable to us or persons acting on our behalf.
3
HEAVY CIVIL CONSTRUCTION - 53% of Q1’20 Revenues RESIDENTIAL CONSTRUCTION - 12% of Q1’20 Revenues
Sterling Construction is a leading heavy civil and residential construction company with strong competitive positions in the Western U.S.
Concrete foundations for single family homes High margin, low CAPEX, quick turnaround slab work with fast cash cycles Low risk – operate exclusively in the high growth markets of Dallas-Fort Worth Metroplex and Houston Heavy highway, commercial concrete projects, aviation, and water containment/treatment Steady 3-5% growth; two-year average project duration Cost-driven
NASDAQ: STRL HQ: The Woodlands, TX Employees: ~3,000 Projects underway: ~200 Shares out: 28.0M Market cap: $289.4M TTM Revenues: $1,199.0M QTD EBITDA*: $20.8M Combined Backlog: $1,432M
TTM Revenues, EBITDA and Backlog as of 3/31/20; market cap as of 6/8/20. *See EBITDA Reconciliation on page 29
SPECIALTY SERVICES – 35% of Q1’20 Revenues
Construction site excavation, drilling and blasting, commercial concrete projects, and drainage work Steady 5-7% growth; six month average project duration Margin enhancing; mid-20% Gross Profit margin
Company Forward P/E 2020 Forward EV/EBITDA 2020 7.9x 5.8x 12.1x 5.0x 28.4x 10.9x 5.8x 3.8x 11.0x 3.5x
24.9x 15.0x
35.5x 19.0x
76.1x 17.1x
4
Data from Bloomberg as of 6/3/20
5
Organic diversification of end-markets driving significant margin and EPS growth.
Disciplined project execution with emphasis on value-driven delivery model.
Operational and financial turnaround has been completed by strong and experienced management team.
Attractive geographic footprint with favorable funding environment.
Acquisition of Plateau provides diversification of revenue streams, a broad range of high-quality customers in rapidly growing end markets, increasing profitability and cash flow, and reduced execution risk for the Company overall; closed on October 2nd, 2019
New credit agreement in conjunction with the Plateau acquisition establishes more traditional balance sheet structure with reduced cost
6
Expan ansi sion
Ad Adjacent acent Markets ts 15%+ margins Grow High Marg rgin n Products cts 50/50 Split at 12%+ margin Solidify ify the Base 7-8% 12% 10% 8% 6% 4% 2021 Blended Margin 2015 Margins
margin improvement in 6 years 2 3
2015 - Focused on Solidifying Base and not taking on losing jobs 2016 - Focused on Solidifying Base and began to Grow High Margin Products…Margins increased to 6.4% 2017 - Continued to Solidify Base, Grow High Margin Products, and began Expansion into Adjacent Markets w/ Tealstone Acquisition...Margins increased to 9.3% 2018 - Continued Elements 1&2 and began growing out Tealstone…Margins increased to 10.6% 2019 - Continued 2018 activities and focus on adding next adjacent Market…Combined Margins will increase to over 12% with the October 2nd, 2019 Plateau acquisition
1
Project Location Value Start Date US-89 Farmington Joint Venture Utah $139 million Q2’20 Bangerter Highway Reconstruction Utah $70 million Q2’20 Multiple Plateau Excavation Awards Southeast US $70 million Q1’20 University Place Garage Utah $26 million Q2’20 Bucholz Army Airfield Runway Marshall Islands $80 million April 2020 Salt Lake City International Airport Utah $97 million Q3’20
7
its highway expertise to also pave airport runways at a higher margin
HI
historically executed large scale projects across a multitude of end-markets in the Rockies, contributing to sustainable margin expansion
UT
0% 100% 200% 300% 400% 500% 600% 2015 2016 2017 2018 2019 2020E Revenue Growth Gross Profit Growth
Gross Margin vs. Revenue Growth
$0 $200 $400 $600 $800 $1,000 $1,200 $1,400 $1,600 2015 2016 2017 2018 2019 2020E
Revenue
0% 2% 4% 6% 8% 10% 12% $- $200 $400 $600 $800 $1,000 $1,200 $1,400 2015 2016 2017 2018 2019
Record Combined Backlog with Improving Margins
Combined Backlog Gross Margin in Combined Backlog $0 $20 $40 $60 $80 $100 $120 $140 2015 2016 2017 2018 2019 2020E
Adjusted EBITDA
Dollar amounts are in millions and 2020 estimates are using pre-COVID 19 guidance.
8
9
March 31, 2020 December 31, 2019 Book to Burn In Q1'2020 Amount Margin % Amount Margin% Backlog $1,190 million 12.7% $1,068 million 11.5% 1.47X Combined Backlog $1,432 million 12.1% $1,342 million 11.0% 1.35X
79% 21%
2016
Heavy Highway Other Heavy Civil, Specialty Services, and Residential 36% 64%
2019 Proforma (1)
Heavy Highway Other Heavy Civil, Specialty Services, and Residential (1) Proforma includes Plateau results for the full year 2019.
10
32% 68%
Q1 2020 Actual
Heavy Highway Other Heavy Civil, Specialty Services, and Residential
11
12
Distribution Center/ Warehouse 51% E-Commerce 18% Data Center 10% Commercial & Residential 16% Energy & Other 5%
Backlog by End Market as of 12/31/18
13
> Can add ~$70 of EBITDA (net of incremental “public company” expense), providing strong free cash flow annually.
> Plateau operates in attractive markets from both a margin and growth perspective. > Mainly excavate for data centers and warehouses, both
migration of data to “The Cloud” and the continued prominence of internet activities
14
15
16
Margins - ~26% GM and ~24% EBITDA Margin- significantly above Sterling core business.
Plateau revenues expected to grow mid-to-high single digits annually for the foreseeable
a rise in e-commerce, the migration of data to “The Cloud” and the Internet of Things.
Diversification of revenue streams by end market, customer type and geographies.
Quick turnaround, more stable projects doing activities we do every day.
Low capex requirements drive high free cash flow.
17
18
($ in millions)
Sterling Plateau Combined Revenue ~1,000 ~290 ~1,290 EBITDA ~56 ~71* ~127 # of Employees ~2,000 ~800 ~2,800
Heavy Highway Construction 39% Other Heavy Civil Construction 28% Residential Construction 11% Plateau 22%
*net of $5 mm of anticipated additional G&A expense *estimates are using pre-COVID 19 guidance
inclusion of a full quarter results from Plateau. Heavy Civil results reflected typical seasonality and both margin and revenue should improve as we begin to ramp up our sizable joint venture projects. Residential improved sequentially, as we continue our ramp up into the Houston market.
quarter of 2020 to $2.8 million from $0.6 million in the first quarter of 2019, as a result of the Plateau Acquisition.
2020 related to the Plateau Acquisition.
from the Plateau.
($MM) Q1 2020 Q1 2019 Revenue $296.7 $223.9 Gross Margin 11.9% 8.7% Adjusted Net Income to STRL (1) $3.5 $2.0 Adjusted EBITDA (2) $20.8 $9.0
(1) Adjusted basis excludes costs related to the acquisition of Plateau, net of tax and non-
cash taxes. See Non-GAAP Reconciliation on pages 27-28.
(2) Adjusted for $0.5 million of acquisition costs. See EBITDA Reconciliation on page 15.
20
but should improve as we begin to ramp up our sizable joint venture projects starting in Q2. Operating profit declined slightly as a result of typical first quarter seasonality.
acquired Plateau business. The quarter increases were primarily attributable to the inclusion of three months of results generated from Plateau operations, in spite of adverse weather conditions.
as a result of heavy rain in March 2020 and the continuing higher demand for smaller homes. Partially offsetting this decline was an increase in completed slabs from our Houston
improved, as the ramp up and increasing scale in Houston had a favorable impact.
($MM) Q1 2020 Q1 2019
Heavy Civil Revenue $155.6 $150.5 Operating Income $(3.6) $(2.1) Operating Margin (%) (2.3) (1.4) Specialty Services Revenue $104.7 $30.7 Operating Income $11.1 $1.0 Operating Margin (%) 10.6 3.4 Residential Revenue $36.4 $42.8 Operating Income $5.1 $5.8 Operating Margin (%) 14.0 13.6 21
NON-CASH ITEMS Q1 2020 Q1 2019 Depreciation $5.5 $3.7 Intangible Amortization $2.8 $0.6 Debt Issuance Cost Amortization $1.0 $0.8 Stock-based Compensation $2.2 $1.0 Federal Income Taxes $0.9 Nil FY 2020 Expectations FY 2019 $22 to $24 $15.9 $11 to $12 $4.8 $4.0 $3.4 $8 to $9 $3.8 21% of Pretax Income Nil OTHER ITEMS Q1 2020 Q1 2019 Interest Expense, including Debt Issuance $7.8 $3.1 CAPEX, net of Divestitures $6.8 $3.7 Changes in Operating Assets and Liabilities (2) $(4.7) $(27.4) FY 2020 Expectations FY 2019 $31 to $33 $16.7 $15 to $25 (1) $14.1 Nil $(3.9)
(1) Wide range as actual spending is dependent on how the COVID-19 uncertainties play out for the balance of 2020. (2) While Sterling will experience quarterly seasonal variations throughout 2020, we do not anticipate a significant change for the full year.
($MM)
22
3.5X 3.0X 1 2 3 4 2019 2020E
Adjusted EBITDA Debt Coverage Ratio
Cash and equivalents $73.9 Current Assets $371.1 Working Capital $84.5 Total Assets $976.4 Current Liabilities $286.3 Total Debt $459.0 Total Liabilities $757.5 Shareholder's Equity $218.9
As of March 31, 2020 ($ in millions)
23
24
25
Organic diversification of end-markets driving significant margin and EPS growth.
Disciplined project execution with emphasis on value-driven delivery model.
Operational and financial turnaround has been completed by strong and experienced management team.
Attractive geographic footprint with favorable funding environment.
Acquisition of Plateau provides diversification of revenue streams, a broad range of high-quality customers in rapidly growing end markets, increasing profitability and cash flow, and reduced execution risk for the Company
New credit agreement in conjunction with the Plateau acquisition establishes more traditional balance sheet structure with reduced cost of capital; significant de-levering anticipated in 2020 and 2021.
26
Ron Ballschmiede Chief Financial Officer 281-214-0777 Fred Buonocore, CFA Senior Vice President 212-836-9607 fbuonocore@equityny.com Mike Gaudreau Associate 212-836-9620 mg@equityny.com
Sterling Construction Company, Inc.
The Equity Group Inc.
27
28
29