state water board s trash and plastic debris initiative
play

State Water Board s Trash and Plastic Debris Initiative: Cutting - PowerPoint PPT Presentation

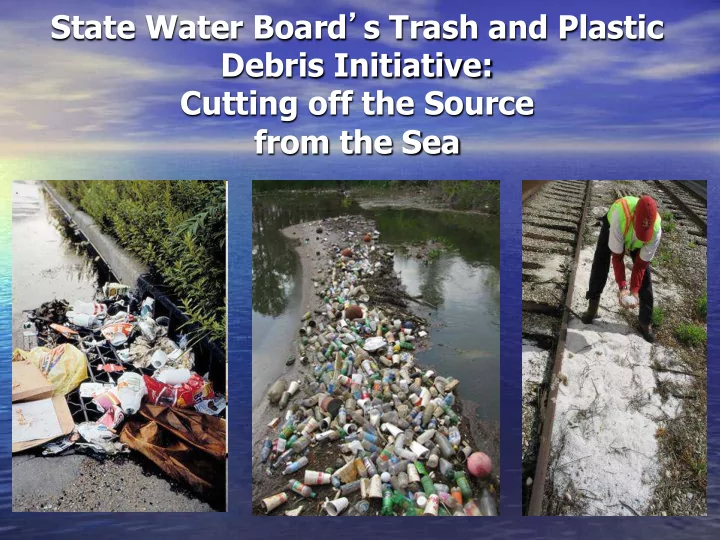
State Water Board s Trash and Plastic Debris Initiative: Cutting off the Source from the Sea Consumer Sources Industrial Sources California Water Board Activities to Address Plastics Consumer Sources of Plastic Debris Total


  1. State Water Board ’ s Trash and Plastic Debris Initiative: Cutting off the Source from the Sea

  2. Consumer Sources Industrial Sources

  3. California Water Board Activities to Address Plastics • Consumer Sources of Plastic Debris – Total Maximum Daily Loads (TMDLs) – Municipal Storm Water Permits • Industrial Sources of Plastic Debris – Preproduction Plastic Debris Program – Industrial Storm Water Permits

  4. Existing Programs • Los Angeles Region ’ s Trash TMDLs – Sets target for “ zero ” trash in waterbodies – 10 year compliance timeline – Sets Performance Standard for compliance • Nine Trash TMDLS adopted • Implemented through the Municipal Storm Water Permit

  5. Is The Trash TMDL Working? • Yes – Over 4000 Trash Capture Devices Installed in the Storm Drain System – 100% Coverage for 16 Cities along Los Angeles River by the end of 2010 – Los Angeles County committed to 100% – City of Calabasas Captured over 2,600 lbs from 43 Devices

  6. L.A. River Watershed Trash Baseline Monitoring 2002-2003 Storm Season Litter Totals 3000 2587 2500 1925 2000 Commercial Litter (lbs) HDSFR 1500 Industrial LDSFR Open Space/Park 1000 550 480 500 124 0 Commercial HDSFR Industrial LDSFR Open Space/Park number of clean-outs = 10

  7. Existing Programs • San Francisco Region ’ s Municipal Storm Water Permit – Set Trash Reduction Targets • 40% by 2014 • 70% by 2017 • 100% by 2022 • Reduce trash entering creeks or the Bay from storm drain systems

  8. Addressing Industrial Sources of Plastic Debris • Preproduction Plastic Debris Program A new program (2008) formed by assembly bill to address storm water discharges of preproduction plastic pellets, the raw material used to produce most common plastic products • Industrial Storm Water Permits 9,500 industrial facilities are enrolled in the Water Board ’ s Industrial Storm Water Permit which addresses pollutants in industrial storm water. Housekeeping measures are included to prevent trash and plastic debris from entering stormwater systems and waterways. We estimate that about 600 of these enrollees handle plastic pellets. .

  9. Why focus on pellets? • Pellets are released from an identifiable source (plastic industrial sites) • Reasons for release are easily correctable – Usually result from poor pellet handling or housekeeping practices

  10. What are preproduction plastic pellets? • Preproduction plastic pellets are small (1-5mm) pellet shaped pieces of plastic that are melted or molded to create most common plastic goods such as food and beverage containers, bags, shrink wrap, and toys – On average, 1 pound of preproduction plastic contains approximately 22,000 pellets. – A 1992 study by the EPA estimated 60 billion pounds of plastic resin is produced in the US per year

  11. Preproduction Plastic Debris Program • How are pellets released? – Transportation – railroad, truck and cargo ships – Manufacturing – consumers of pellets • What is being done to reduce pellets releases? – Inspection – we conducted over 100 inspections at over 60 facilities since January 2009 – Enforcement - we have issued over 10 NOVs, 2 CAOs and hundreds of staff enforcement letters for facilities failing to comply • How many pellets are on California ’ s coast? – A sampling program is underway to estimate how many pellets are on California ’ s beaches and where they are concentrated

  12. Current Enforcement Initiative – Bag/Film • Focus on Bag/Film Manufacturers – They represent a large amount of all pellets consumed – They tend to have no food/medical standards to protect with final product – i.e., tend to be more messy – They move around quite easily and a large number of them are nonfilers • 428 bag/film facilities statewide • Ranked using facility size, rail access and proximity to receiving water factors • Inspected 100% of top rank (34 facilities) • Enforcement follow-up on 100% of the noncompliant facilities

  13. Future Initiatives: Statewide Trash Policy

  14. Trash Policy • Would build on Los Angeles and San Francisco Water Boards Efforts • Set Statewide Goal for Trash – Zero Trash in Water • Implementation Plan – Set Performance Standard for Trash Capture for Storm Water Systems – Could Prioritize by Land Use

  15. Status • CEQA Scoping Meetings – Northern Southern California October, 2010 • Environmental Documents and Draft for Public Comment Summer 2011 • Board Consideration early 2012

Download Presentation
Download Policy: The content available on the website is offered to you 'AS IS' for your personal information and use only. It cannot be commercialized, licensed, or distributed on other websites without prior consent from the author. To download a presentation, simply click this link. If you encounter any difficulties during the download process, it's possible that the publisher has removed the file from their server.

Recommend


More recommend