State and Local Energy Efficiency Action Network Network of 200+ - - PowerPoint PPT Presentation

state and local energy efficiency action network
SMART_READER_LITE
LIVE PREVIEW

State and Local Energy Efficiency Action Network Network of 200+ - - PowerPoint PPT Presentation

State and Local Energy Efficiency Action Network Network of 200+ leaders and professionals, led by state and local policymakers, bringing energy efficiency to scale Support on energy efficiency policy and program decision making for: o


slide-1
SLIDE 1

State and Local Energy Efficiency Action Network

1

  • Network of 200+ leaders and

professionals, led by state and local policymakers, bringing energy efficiency to scale

  • Support on energy efficiency policy

and program decision making for:

  • Utility regulators, utilities and consumer advocates
  • Legislators, governors, mayors, county officials
  • Air and energy office directors, and others
  • Facilitated by DOE and EPA;

successor to the National Action Plan for Energy Efficiency

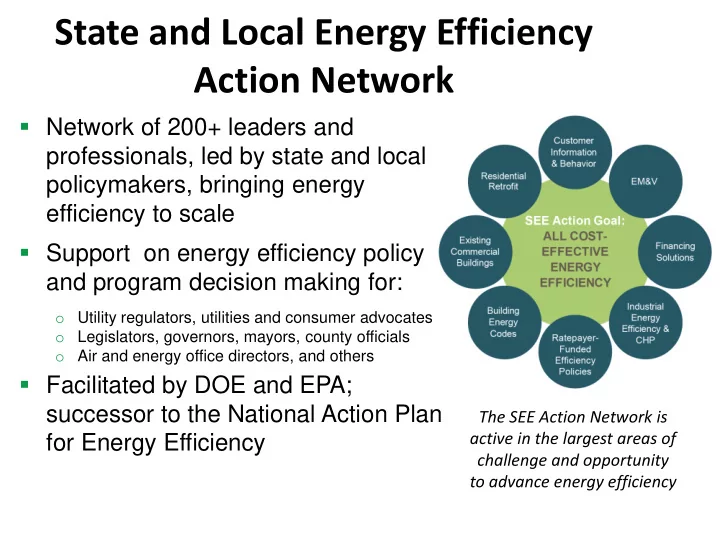
The SEE Action Network is active in the largest areas of challenge and opportunity to advance energy efficiency

slide-2
SLIDE 2

Insights from Smart Meters: Focus on Home Energy Report Programs

Annika Todd, Michael Li, Michael Sullivan November 2013

slide-3
SLIDE 3

3

Smart meters increasingly rolled

  • ut
slide-4
SLIDE 4
  • What can we do with this data?
  • Many possibilities
  • Valuable for a range of energy programs
  • Today: focus on behavior-based (BB) programs
  • Specifically: Home Energy Report (HER) programs
  • An illustrative example of the value of this analysis

4

Smart meter data enables new types of analysis

slide-5
SLIDE 5

5

What is a HER program?

slide-6
SLIDE 6

Key policy questions:

  • 1. Do these programs have potential to provide peak-

hour savings? (Yes – for our dataset)

  • 2. What actions and characteristics are related to

savings? (Suggestive of AC – best guess: changing thermostat set point)

  • 3. What is the short-term persistence of savings?

(Savings within one-two weeks after first report mailed, stabilize after second report)

6

Key policy questions for HER (and BB) programs

slide-7
SLIDE 7

Key policy questions:

  • 1. Do these programs have potential to provide peak-

hour savings? (Yes – for our dataset)

  • 2. What actions and characteristics are related to

savings? (Suggestive of AC – best guess: changing thermostat set point)

  • 3. What is the short-term persistence of savings?

(Savings within one-two weeks after first report mailed, stabilize after second report)

7

Key policy questions for HER (and BB) programs

slide-8
SLIDE 8

Key policy questions:

  • 1. Do these programs have potential to provide peak-

hour savings? (Yes – for our dataset)

  • 2. What actions and characteristics are related to

savings? (Suggestive of AC – best guess: changing thermostat set point)

  • 3. What is the short-term persistence of savings?

(Savings within one-two weeks after first report mailed, stabilize after second report)

8

Key policy questions for HER (and BB) programs

slide-9
SLIDE 9

Key policy questions:

  • 1. Do these programs have potential to provide peak-

hour savings? (Yes – for our dataset)

  • 2. What actions and characteristics are related to

savings? (Suggestive of AC – best guess: changing thermostat set point)

  • 3. What is the short-term persistence of savings?

(Savings within one-two weeks after first report mailed, stabilize after second report)

9

Key policy questions for HER (and BB) programs

slide-10
SLIDE 10

Key policy questions:

  • 1. Do these programs have potential to provide peak-

hour savings? (Yes – for our dataset)

  • 2. What actions and characteristics are related to

savings? (Suggestive of AC – best guess: changing thermostat set point)

  • 3. What is the short-term persistence of savings?

(Savings within one-two weeks after first report mailed, stabilize after second report)

10

Key policy questions for HER (and BB) programs

slide-11
SLIDE 11

Key policy questions:

  • 1. Do these programs have potential to provide peak-

hour savings? (Yes – for our dataset)

  • 2. What actions and characteristics are related to

savings? (Suggestive of AC – best guess: changing thermostat set point)

  • 3. What is the short-term persistence of savings?

(Savings within one-two weeks after first report mailed, stabilize after second report)

11

Key policy questions for HER (and BB) programs

slide-12
SLIDE 12
  • Smart meter data enables many opportunities for

new forms of analysis

  • Purpose of this study: focus on one particular

aspect of this analysis enabled by smart meters – what insights can we gain into Home Energy Report (HER) programs?

  • Description of data
  • Analyses and results
  • Conclusions and future research

12

Outline

slide-13
SLIDE 13
  • HER program implemented as a “randomized

controlled trial”

  • Hourly electricity data from Pacific Gas &

Electric’s (PG&E) AMI system

  • Two datasets from different rollouts (“waves”)

13

Data description

# Treat # Control Launch Date Hourly interval data available PG&E baseline territory Quartile of energy use Wave One 400,000 100,000 Feb 2012 Aug 1, 2012- Oct 31, 2012 P, Q, R, S, T, V, W, X, Y Top 3 quartiles Gamma Wave 72,300 72,300 Nov 2011 Nov 4, 2011- Aug 1, 2012 R, S, T, W, X All quartiles

slide-14
SLIDE 14
  • Smart meter data enables many opportunities for

new forms of analysis

  • Purpose of this study: focus on one particular

aspect of this analysis enabled by smart meters – what insights can we gain into Home Energy Report (HER) programs?

  • Description of HERs, data, limitations of report
  • Analyses and results
  • Conclusions and future research

14

Outline

slide-15
SLIDE 15

Key policy questions:

  • 1. Do these programs have potential to provide peak-hour

savings?

Analysis 1: Estimate the hour-by-hour savings profile

(Wave One – late summer)

  • 2. What actions and characteristics are related to savings?

Analysis 2: segment by customer characteristics to

identify “high-savers” (Wave One – late summer)

  • 3. What is the short-term persistence of savings?

Analysis 3: segment across days after reports are mailed

(Gamma – winter and spring)

15

Three analyses – each focusing on one key policy question

slide-16
SLIDE 16

Key policy questions:

  • 1. Do these programs have potential to provide peak-hour

savings?

Analysis 1: Estimate the hour-by-hour savings profile

(Wave One – late summer)

  • 2. What actions and characteristics are related to savings?

Analysis 2: segment by customer characteristics to

identify “high-savers” (Wave One – late summer)

  • 3. What is the short-term persistence of savings?

Analysis 3: segment across days after reports are mailed

(Gamma – winter and spring)

16

Three analyses – each focusing on one key policy question

slide-17
SLIDE 17

0% 1% 2% 5 10 15 20 25 Hour

slide-18
SLIDE 18

Key policy questions:

  • 1. Do these programs have potential to provide peak-hour

savings?

Analysis 1: Estimate the hour-by-hour savings profile

(Wave One – late summer)

  • 2. What actions and characteristics are related to savings?

Analysis 2: segment by customer characteristics to

identify “high-savers” (Wave One – late summer)

  • 3. What is the short-term persistence of savings?

Analysis 3: segment across days after reports are mailed

(Gamma – winter and spring)

18

Three analyses – each focusing on one key policy question

slide-19
SLIDE 19

0% 1% 2% 5 10 15 20 25 Hour

slide-20
SLIDE 20

0% 1% 2% 3% 5 10 15 20 25 Hour

slide-21
SLIDE 21

0% 1% 2% 3% 5 10 15 20 25 Hour

slide-22
SLIDE 22

0% 1% 2% 3% 5 10 15 20 25 Hour

slide-23
SLIDE 23

0% 1% 2% 3% 4% 5 10 15 20 25 Hour

slide-24
SLIDE 24

0% 1% 2% 3% 4% 5 10 15 20 25 Hour

slide-25
SLIDE 25

0% 1% 2% 3% 4% 5 10 15 20 25 Hour

slide-26
SLIDE 26

0% 1% 2% 3% 4% 5 10 15 20 25 Hour

slide-27
SLIDE 27

0% 1% 2% 3% 4% 5 10 15 20 25 Hour

slide-28
SLIDE 28

0% 1% 2% 3% 4% 5 10 15 20 25 Hour

slide-29
SLIDE 29

Key policy questions:

  • 1. Do these programs have potential to provide peak-hour

savings?

Analysis 1: Estimate the hour-by-hour savings profile

(Wave One – late summer)

  • 2. What actions and characteristics are related to savings?

Analysis 2: segment by customer characteristics to

identify “high-savers” (Wave One – late summer)

  • 3. What is the short-term persistence of savings?

Analysis 3: segment across days after reports are mailed

(Gamma – winter and spring)

29

Three analyses – each focusing on one key policy question

slide-30
SLIDE 30

0% 1% 2% 3% 5 10 15 20 25 Day after mailing

Mailing 1

Mailing 1

slide-31
SLIDE 31

0% 1% 2% 3% 5 10 15 20 25 Day after mailing

Mailing 1

5 10 15 20 25 Day after mailing

Mailing 2

Mailing 1 Mailing 2

slide-32
SLIDE 32

0% 1% 2% 3% 5 10 15 20 25 Day after mailing

Mailing 1

5 10 15 20 25 Day after mailing

Mailing 2

10 20 30 40 Day after mailing

Mailing 3

Mailing 1 Mailing 2 Mailing 3

slide-33
SLIDE 33 0% 1% 2% 3% 5 10 15 20 25 Day after mailing

Mailing 1

5 10 15 20 25 Day after mailing

Mailing 2

10 20 30 40 50 Day after mailing

Mailing 3

10 20 30 40 50 Day after mailing

Mailing 4

Mailing 1 Mailing 2 Mailing 3 Mailing 4

slide-34
SLIDE 34
  • Smart meter data enables many opportunities for

new forms of analysis

  • Purpose of this study: focus on one particular

aspect of this analysis enabled by smart meters – what insights can we gain into Home Energy Report (HER) programs?

  • Description of HERs, data, limitations of report
  • Analyses and results
  • Conclusions and future research

34

Outline

slide-35
SLIDE 35
  • Limited data access
  • Limited time period
  • Only a few rollouts

35

Limitations of the report

slide-36
SLIDE 36
  • Lots of smart meter data
  • Opportunity for new types of analysis
  • Today – one example of the value of this data
  • We show (for our datasets):

1.

Potential for peak-hour savings from HERs

2.

Savings driven by actions related to AC

3.

Savings show increase within one-two weeks of first mailing, stabilize after second mailing

  • Many other examples of the value of this data
  • Future – a lot of potential research

36

Conclusions

slide-37
SLIDE 37

Annika Todd: atodd@lbl.gov

37

Questions?