
SLIDE 1
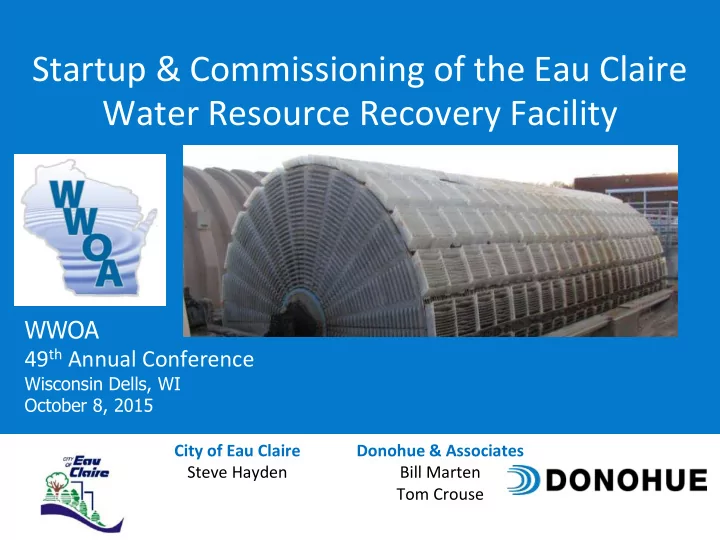
Startup & Commissioning of the Eau Claire Water Resource Recovery Facility
WWOA 49th Annual Conference
Wisconsin Dells, WI October 8, 2015 City of Eau Claire Steve Hayden Donohue & Associates Bill Marten Tom Crouse
Startup & Commissioning of the Eau Claire Water Resource Recovery - - PowerPoint PPT Presentation
Startup & Commissioning of the Eau Claire Water Resource Recovery Facility WWOA 49 th Annual Conference Wisconsin Dells, WI October 8, 2015 City of Eau Claire Donohue & Associates Steve Hayden Bill Marten Tom Crouse Presentation
Wisconsin Dells, WI October 8, 2015 City of Eau Claire Steve Hayden Donohue & Associates Bill Marten Tom Crouse
Page 2| October 8, 2015 WWOA 49th Annual Conference
Page 3| October 8, 2015 WWOA 49th Annual Conference
Page 4| October 8, 2015 WWOA 49th Annual Conference
RBCs Primary Clarifiers RWW Pumps/Screening/ Grit Removal Final Clarifiers Administration/ Laboratory Bldg Secondary Digesters Primary Digesters Sludge Storage Chlorine Contact Basins
Page 5| October 8, 2015 WWOA 49th Annual Conference
Page 6| October 8, 2015 WWOA 49th Annual Conference
Page 7| October 8, 2015 WWOA 49th Annual Conference
Page 8| October 8, 2015 WWOA 49th Annual Conference
Page 9| October 8, 2015 WWOA 49th Annual Conference
Page 10| October 8, 2015 WWOA 49th Annual Conference
Page 11| October 8, 2015 WWOA 49th Annual Conference
Page 12| October 8, 2015 WWOA 49th Annual Conference
Page 13| October 8, 2015 WWOA 49th Annual Conference
Page 14| October 8, 2015 WWOA 49th Annual Conference
Page 15| October 8, 2015 WWOA 49th Annual Conference
Page 16| October 8, 2015 WWOA 49th Annual Conference
Page 17| October 8, 2015 WWOA 49th Annual Conference
Page 18| October 8, 2015 WWOA 49th Annual Conference
Page 19| October 8, 2015 WWOA 49th Annual Conference
Page 20| October 8, 2015 WWOA 49th Annual Conference
Page 21| October 8, 2015 WWOA 49th Annual Conference
Page 22| October 8, 2015 WWOA 49th Annual Conference
Page 23| October 8, 2015 WWOA 49th Annual Conference
Page 24| October 8, 2015 WWOA 49th Annual Conference
Effluent pH (s.u.) NH3-N Limit (mg/L) Effluent pH (s.u.) NH3-N Limit (mg/L) 6.0 < pH ≤ 6.1 108 7.6 < pH ≤ 7.7 29 6.1 < pH ≤ 6.2 106 7.7 < pH ≤ 7.8 24 6.2 < pH ≤ 6.3 104 7.8 < pH ≤ 7.9 20 6.3 < pH ≤ 6.4 101 7.9 < pH ≤ 8.0 17 6.4 < pH ≤ 6.5 98 8.0 < pH ≤ 8.1 14 6.5 < pH ≤ 6.6 94 8.1 < pH ≤ 8.2 11 6.6 < pH ≤ 6.7 89 8.2 < pH ≤ 8.3 9.4 6.7 < pH ≤ 6.8 84 8.3 < pH ≤ 8.4 7.8 6.8 < pH ≤ 6.9 78 8.4 < pH ≤ 8.5 6.4 6.9 < pH ≤ 7.0 72 8.5 < pH ≤ 8.6 5.3 7.0 < pH ≤ 7.1 66 8.6 < pH ≤ 8.7 4.4 7.1 < pH ≤ 7.2 59 8.7 < pH ≤ 8.8 3.7 7.2 < pH ≤ 7.3 52 8.8 < pH ≤ 8.9 3.1 7.3 < pH ≤ 7.4 46 8.9 < pH ≤ 9.0 2.6 7.4 < pH ≤ 7.5 40
Page 25| October 8, 2015 WWOA 49th Annual Conference
Page 26| October 8, 2015 WWOA 49th Annual Conference
Page 27| October 8, 2015 WWOA 49th Annual Conference
Page 28| October 8, 2015 WWOA 49th Annual Conference
Page 29| October 8, 2015 WWOA 49th Annual Conference
Primary Effluent SEL 1 SEL 2 SEL 3 Swing 2 Aer 1 Aer 2 Aer 3 Aer 4 Ideal clarifier10 To Disinfec WAS Splitter13 Splitter22 Splitter18 SEL 4 SEL 5 SEL 6 SWING 1 Splitter20 Splitter38 Splitter36 Splitter49 ALK
Page 30| October 8, 2015 WWOA 49th Annual Conference
PE E1 E2 E3 E4 E5 E6 W3 W2 W1 W6 W5 W4 WC WB WA EA EB EC D E F G RAS
Page 31| October 8, 2015 WWOA 49th Annual Conference
Page 32| October 8, 2015 WWOA 49th Annual Conference
Page 33| October 8, 2015 WWOA 49th Annual Conference
Page 34| October 8, 2015 WWOA 49th Annual Conference
Page 35| October 8, 2015 WWOA 49th Annual Conference
Page 36| October 8, 2015 WWOA 49th Annual Conference
Page 37| October 8, 2015 WWOA 49th Annual Conference
Page 38| October 8, 2015 WWOA 49th Annual Conference
Page 39| October 8, 2015 WWOA 49th Annual Conference
Page 40| October 8, 2015 WWOA 49th Annual Conference
Page 41| October 8, 2015 WWOA 49th Annual Conference
Page 42| October 8, 2015 WWOA 49th Annual Conference
Page 43| October 8, 2015 WWOA 49th Annual Conference
Page 44| October 8, 2015 WWOA 49th Annual Conference
Date Ave Final 30 Minute Yesterday's Yesterday's Yesterday's Today's MLSS RAS/WAS Clar Blanket Settling Volume Plant Flow Effluent TSS WAS Flow SVI mg/L mg/L ft mL MGD (mg/L) gal/day mL/g 09/05/15 2,340 6,000 1 160 5.76 3 117,000 68 09/04/15 2,460 5,650 1 170 5.31 3 115,000 69 09/03/15 2,160 5,400 1 160 5.11 3 105,000 74 09/02/15 2,320 6,600 1 170 4.72 4 94,000 73 09/01/15 2,340 5,900 1 160 5.01 4 88,000 68 08/31/15 3,840 8,350 1 270 4.68 3 87,000 70 08/30/15 4,060 10,900 1 270 5.24 4 89,000 67 08/29/15 3,920 10,850 1 275 5.35 2 91,000 70 08/28/15 4,220 9,300 1 280 5.24 3 90,000 66 08/27/15 3,760 9,100 1 265 5.47 3 88,000 70 08/26/15 3,920 7,600 1 270 5.24 3 88,000 69 08/25/15 3,860 8,150 260 4.74 1 87,000 67 08/24/15 3,460 8,250 1 260 5.86 3 86,000 75 08/23/15 4,100 9,850 1 275 5.06 2 86,000 67 08/22/15 4,000 9,750 1 270 5.50 2 85,000 68 08/21/15 3,900 9,150 1 280 5.40 3 86,000 72 08/20/15 4,120 9,750 1 270 5.64 3 85,000 66 08/19/15 4,080 9,750 280 5.06 2 85,000 69 08/18/15 3,840 8,450 1 255 5.77 2 83,000 66 08/17/15 3,740 9,850 1 260 5.46 3 83,000 70 Today's Values
Page 45| October 8, 2015 WWOA 49th Annual Conference
Page 46| October 8, 2015 WWOA 49th Annual Conference
Page 47| October 8, 2015 WWOA 49th Annual Conference
Page 48| October 8, 2015 WWOA 49th Annual Conference