SLIDE 1
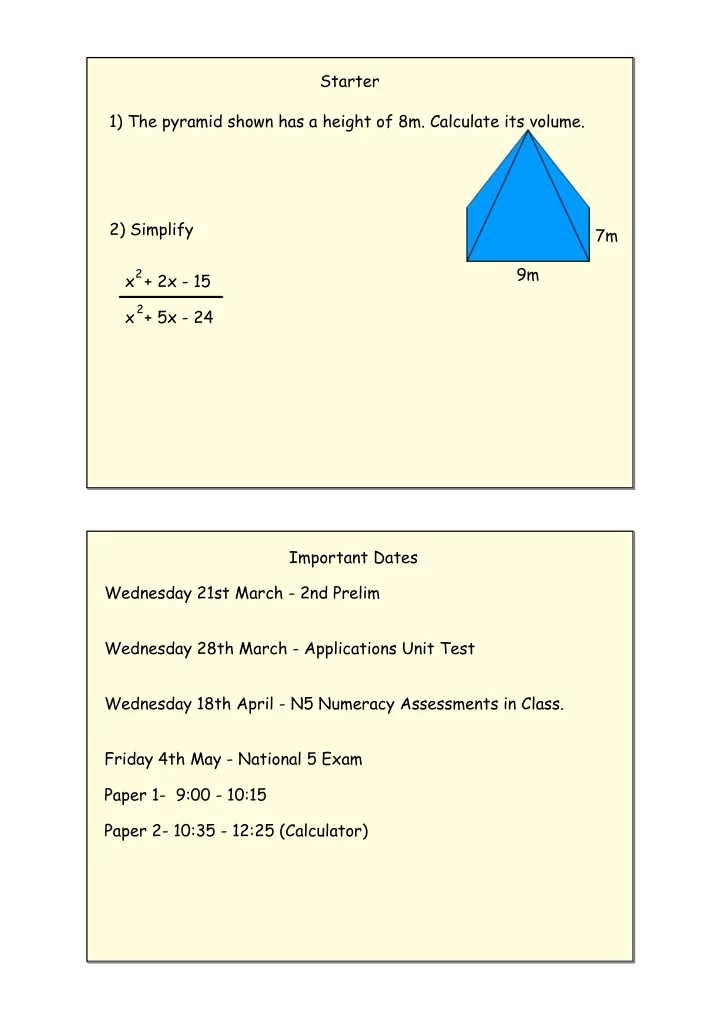
Starter 1) The pyramid shown has a height of 8m. Calculate its volume. 2) Simplify 7m 9m x + 2x - 15 x + 5x - 24
2 2
Important Dates Wednesday 21st March - 2nd Prelim Wednesday 28th March - Applications Unit Test Wednesday 18th April - N5 Numeracy Assessments in Class. Friday 4th May - National 5 Exam Paper 1- 9:00 - 10:15 Paper 2- 10:35 - 12:25 (Calculator)
SLIDE 2
Quartiles Today we are learning... What quartiles are and how to calculate it. I will know if I have been successful if... I understand what the quartiles represent. I can find the median. I can find the upper and lower quartiles. The Quartiles Quartiles help us to investigate the spread of the data.
SLIDE 3
The Quartiles Lower Quartile - Q 25% of the data is below this point. Median - Q 50% of the data is below this point. Upper Quartile - Q 75% of the data is below this point.
1
2 3
The Interquartile Range Q - Q
1
3
The Semi - Interquartile Range (Q - Q )
1
3
1
2 The Quartiles
1
3
Given a data set containing n values the.... Lower Quartile Q = Upper Quartile Q = (n + 1) 4 3(n + 1) 4 th value th value
SLIDE 4
1
3
Given a data set containing n values the.... Lower Quartile Q = Upper Quartile Q = (n + 1) 4 3(n + 1) 4 Quartiles Calculate the IQR & SIQR of the following data set... 5, 8, 9, 10, 11, 12, 15 th value th value
SLIDE 5
Summary Starter 1) Solve 3 - 2cos(x) = 0 for 0 < x < 360 2) Calculate 3 7
+ 2
1
4
SLIDE 6
Box Plots Today we are learning... How to plot a box plot. I will know if I have been successful if... I can find the median, upper and lower quartile of a set of data. I can find the maximum and minimum value of a set of data. I can plot a suitable box plot to represent a set of data.
SLIDE 7
Display the Data in a Box Plot Test Scores (%) from the Prelim for those who completed 4 past papers out of 8: 11, 22, 31, 33, 48, 48, 49, 56, 58, 60, 66
SLIDE 8
Starter 1) Solve 9cos(x) - 8 = 0 for 0 < x < 360 2) Calculate the volume of a sphere with diameter 8.6cm. 3) Factorise y = 4x - 49
2
SLIDE 9
Scattergraphs Today we are learning... How to sketch and interpret scattergraphs. I will know if I have been successful if... Using suitable axes I can plot points to for a scattergraph. I can draw a line of best fit. I can use the line of best fit to predict values. strong positive correlation weak positive correlation strong negative correlation weak negative correlation no correlation
SLIDE 10
Plotting Past Papers Completed 4 6 4 3 1 Prelim Score 79 62 48 28 30 17 Higher Prelim - Dec 2017 1 2 3 4 5 6 15 25 35 45 55 65 75 85 Prelim Score Past Papers Completed Plotting Higher Prelim - Dec 2017 Use your scattergraph to predict what a student would have scored if they had completed 5 past papers?
SLIDE 11
Consumption of sour cream, per person in half pints in the US (x) vs
Motorcycle accidents, in the US in non collision transport accidents (y)
x y Consumption of sour cream, per person in half pints in the US vs Motorcycle accidents, in the US in non collision transport accidents. Correlation does not imply Causation
SLIDE 12
Correlation does not imply causation. Real World Examples of Correlation does not imply causation. Page 21 - Question 1 Onwards
SLIDE 13
Starter Calculate the equation of the line of best fit... Temperature Outside (C) Ice Creams Sold 1 2 3 4 5 10 12 14 16 18 Hint: m = y - b = m(x - a)