
SLIDE 1
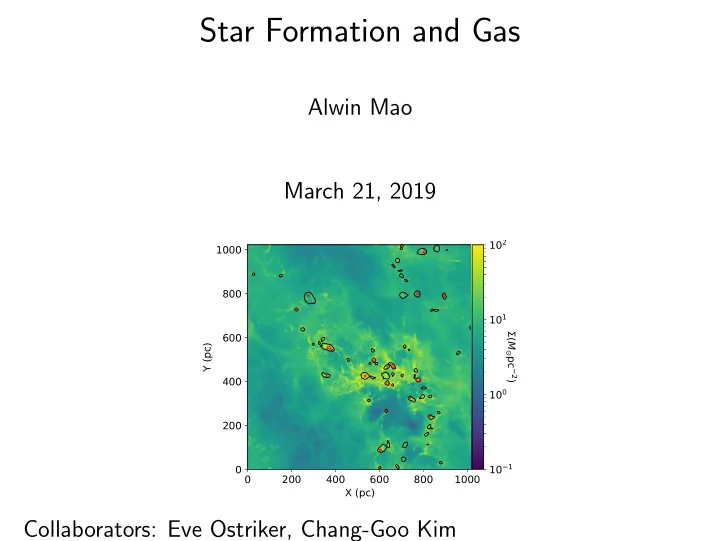
Star Formation and Gas
Alwin Mao March 21, 2019
200 400 600 800 1000 X (pc) 200 400 600 800 1000 Y (pc) 10
1
100 101 102 (M pc
2)
Star Formation and Gas Alwin Mao March 21, 2019 10 2 1000 800 10 - - PowerPoint PPT Presentation
Star Formation and Gas Alwin Mao March 21, 2019 10 2 1000 800 10 1 600 ( M pc Y (pc) 400 2 ) 10 0 200 0 10 1 0 200 400 600 800 1000 X (pc) Collaborators: Eve Ostriker, Chang-Goo Kim Outline 1 Introduction: Efficiency of What Gas?
200 400 600 800 1000 X (pc) 200 400 600 800 1000 Y (pc) 10
1
100 101 102 (M pc
2)
1 Introduction: Efficiency of What Gas? 2 Time Series: Delay and Variability 3 Correlation Comparison of Density vs. Energy 4 Plans++
Alwin Mao Star Formation and Gas March 21, 2019 2 / 23
1 Introduction: Efficiency of What Gas? 2 Time Series: Delay and Variability 3 Correlation Comparison of Density vs. Energy 4 Plans++
Alwin Mao Star Formation and Gas March 21, 2019 3 / 23
M tff
Alwin Mao Star Formation and Gas March 21, 2019 4 / 23
Alwin Mao Star Formation and Gas March 21, 2019 5 / 23
200 400 600 800 1000 X (pc) 200 400 600 800 1000 Y (pc) 10
1
100 101 102 (M pc
2)
10
1
100 101 102 (M pc
2) Alwin Mao Star Formation and Gas March 21, 2019 6 / 23
Alwin Mao Star Formation and Gas March 21, 2019 7 / 23
Alwin Mao Star Formation and Gas March 21, 2019 8 / 23
10 20 30 40 50 60 Tree Index 320 310 300 290 280 270 260 250 240
411 200 400 600 800 1000 X (pc) 200 400 600 800 1000 Y (pc) 10
1
100 101 102 (M pc
2)
Alwin Mao Star Formation and Gas March 21, 2019 9 / 23
2.5 5.0 7.5 10.0 12.5 15.0 17.5 20.0 Tree Index 820 810 800 790 780
Alwin Mao Star Formation and Gas March 21, 2019 10 / 23
200 400 600 800 1000 X (pc) 200 400 600 800 1000 Y (pc) 10
1
100 101 102 (M pc
2) Alwin Mao Star Formation and Gas March 21, 2019 11 / 23
1 Introduction: Efficiency of What Gas? 2 Time Series: Delay and Variability 3 Correlation Comparison of Density vs. Energy 4 Plans++
Alwin Mao Star Formation and Gas March 21, 2019 12 / 23
10
1
100 101 nH 10
0.5 0cm 3
SFR density bin delayed 10
1
100 101 nH 100
0.5cm 3
300 350 400 450 500 550 600 650 700 Time (Myr) 10
1
100 101 nH 100.5
1cm 3 ff (Mass / tff) / <SFR>
Alwin Mao Star Formation and Gas March 21, 2019 13 / 23
10
1
100 101 nH 101
1.5cm 3
SFR density bin delayed 10
1
100 101 nH 101.5
2cm 3
300 350 400 450 500 550 600 650 700 Time (Myr) 10
1
100 101 nH 102
2.5cm 3 ff (Mass / tff) / <SFR>
Alwin Mao Star Formation and Gas March 21, 2019 14 / 23
3)
Alwin Mao Star Formation and Gas March 21, 2019 15 / 23
10
1
100 101 HBR SFR density bin delayed 300 350 400 450 500 550 600 650 700 Time (Myr) 10
1
100 101 HBP
ff (Mass / tff) / <SFR> Alwin Mao Star Formation and Gas March 21, 2019 16 / 23
1 Introduction: Efficiency of What Gas? 2 Time Series: Delay and Variability 3 Correlation Comparison of Density vs. Energy 4 Plans++
Alwin Mao Star Formation and Gas March 21, 2019 17 / 23
nH > 10 nH > 30 nH > 100 HBR 10
2
10
1
100
ff
nH > 10 nH > 30 nH > 100 HBR 0.0 0.2 0.4 0.6 0.8 1.0
SFR/ < SFR >
Alwin Mao Star Formation and Gas March 21, 2019 18 / 23
nH > 10 nH > 30 nH > 100 HBR 1.0 0.5 0.0 0.5 1.0 1.5 2.0 nH > 10 nH > 30 nH > 100 HBR 0.0 0.2 0.4 0.6 0.8 1.0
SFR/ < SFR >
Alwin Mao Star Formation and Gas March 21, 2019 19 / 23
nH > 10 nH > 30 nH > 100 HBR 1 2 3 4 5 6 7 8 9 Cutoff
v
nH > 10 nH > 30 nH > 100 HBR 0.0 0.2 0.4 0.6 0.8 1.0
SFR/ < SFR >
Alwin Mao Star Formation and Gas March 21, 2019 20 / 23
1 Introduction: Efficiency of What Gas? 2 Time Series: Delay and Variability 3 Correlation Comparison of Density vs. Energy 4 Plans++
Alwin Mao Star Formation and Gas March 21, 2019 21 / 23
Alwin Mao Star Formation and Gas March 21, 2019 22 / 23
Alwin Mao Star Formation and Gas March 21, 2019 23 / 23