
SLIDE 1
Effects of automated highway speed enforcement: average versus instantaneous speed control
27th annual ICTCT workshop 16-17 Oct 2014, Karlsruhe - Germany
- dr. Stijn Daniels, PhD
Transportation Research Institute Hasselt University, Belgium stijn.daniels@uhasselt.be
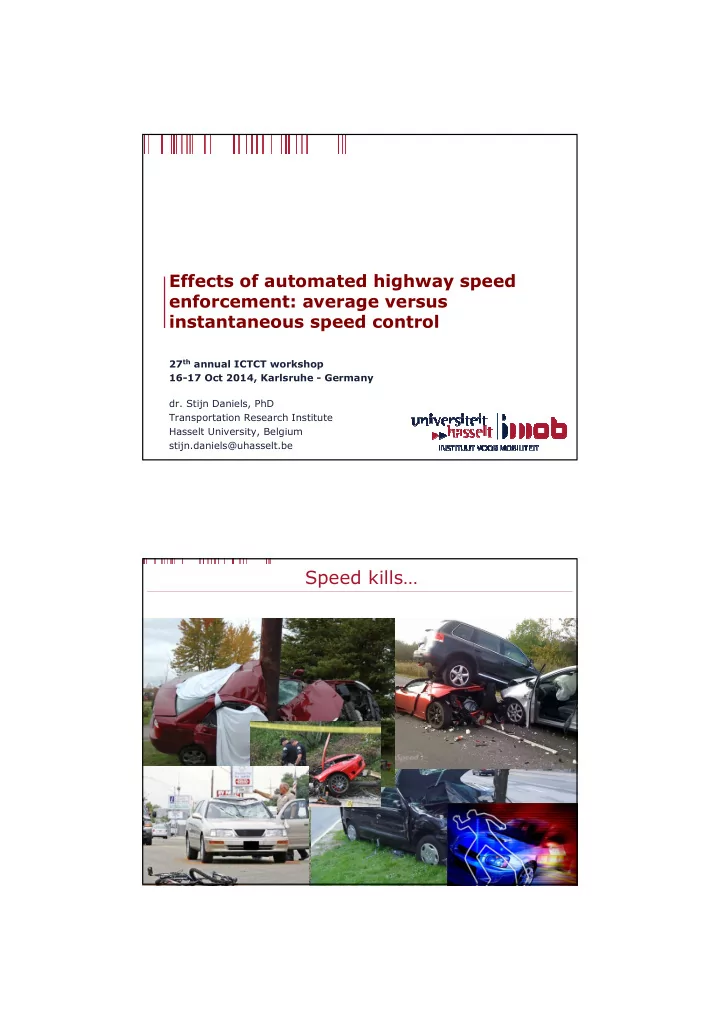
Speed kills…
2