
SLIDE 1
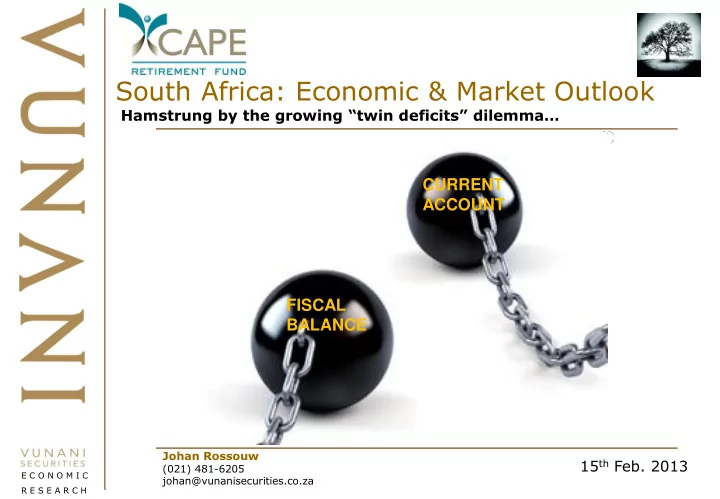
South Africa: Economic & Market Outlook
Johan Rossouw
(021) 481-6205 johan@vunanisecurities.co.za
15th Feb. 2013
E C O N O M I C R E S E A R C H
South Africa: Economic & Market Outlook Hamstrung by the growing - - PowerPoint PPT Presentation
South Africa: Economic & Market Outlook Hamstrung by the growing twin deficits dilemma CURRENT ACCOUNT FISCAL BALANCE Johan Rossouw 15 th Feb. 2013 (021) 481-6205 E C O N O M I C johan@vunanisecurities.co.za R E S E A R C H
Johan Rossouw
(021) 481-6205 johan@vunanisecurities.co.za
E C O N O M I C R E S E A R C H
Source: IMF WEO Update, Feb13
Source: IMF WEO Update, Feb13
Source: SARB Quarterly Bulletin, Dec.‘12
Source: IMF WEO Update, Feb13
Source: Inet-Bridge
Source: Inet-Bridge
Source: National Planning Commission
Source: National Planning Commission
Source: National Planning Commission
Source: STATSSA
Source: SARB Quarterly Bulletin, Dec.‘12
Source: SARB Quarterly Bulletin, Dec.‘12
Source: SARB Quarterly Bulletin, Dec.‘12
Source: SARB Quarterly Bulletin, Dec.‘12
Source: SARB Quarterly Bulletin, Dec.‘12
Source: INET & Vunani calculations and forecasts
Source: INET
Sources: STATSSA & Vunani Securities calculations
Source: INET
Source: I-NET Bridge & Vunani calculations
Source: I-NET Bridge
Sources: INET & Vunani calculations and forecasts
Rolling twelve months equity performance Base case Spot Rolling twelve months ending:
Rolling 2 yr
31-Jan-13 31-Jan-14 01-Feb-15
average/year
FTSE/JSE Alsi Index 40483 45459 49972 Exit PER (X) 15.21 15.0 14.2 EPS 2661.47 3037.9 3525.2 EPS growth (%) 5.70 14.1 16.0 Growth in FTSE/JSE Alsi index (%) 12.3 9.9
11.11
Bull case Rolling twelve months ending: 31-Jan-13 31-Jan-14 01-Feb-15 FTSE/JSE Alsi Index 40482.92 52429 58061 Exit PER (X) 15.21 17.3 16.5 EPS 2661.47 3037.9 3525.2 EPS growth (%) 14.1 16.0 Growth in FTSE/JSE Alsi index (%) 29.5 10.7
20.13
Bear case Rolling twelve months ending: 31-Jan-13 31-Jan-14 01-Feb-15 FTSE/JSE Alsi Index 40482.92 38488 41884 Exit PER (X) 15.21 12.7 11.9 EPS 2661.47 3037.9 3525.2 EPS growth (%) 14.1 16.0 Growth in FTSE/JSE Alsi index (%)
8.8
1.95
Sources: INET & Vunani calculations and forecasts
Sources: SARB, STATSSA, INET & Vunani calculations and forecasts 2012Est. 2013F'cast 2014F'cast 2015F'cast Real final household consumption expenditure (%) 3.5 3.0 4.2 3.8 Real government consumption expenditure (%) 4.5 4.7 4.6 4.7 Real gross fixed capital formation (%) 6.5 6.8 7.0 6.0 Change in inventories (R bn.) 7.3 9.5
REAL GROSS DOMESTIC EXPENDITURE (%) 4.3 4.1 4.3 4.4 Real export growth (%) 0.5 3.5 5.7 8.0 Real import growth (%) 7.5 7.1 7.2 8.5 Nominal net exports (R bn.)
REAL GROSS DOMESTIC PRODUCT (%) 2.5 2.5 3.1 3.7 Current account (R bn.)
Current account as % of GDP
Financial account (incl. unrecorded trans.) (R bn.) 160 190 250 300 CHANGE IN NET RESERVES (R bn.)
0.0 28.0 Headline inflation (avg.) (%) 5.6 5.7** 5.1** 5.2 Headline inflation (year-end) (%) 5.7 5.3** 5.2** 5.4 Producer inflation(average) (%) 6.2 6.5* 4.8* 4.5 Producer inflation (year-end) (%) 5.2 4.5* 7.0* 4.5 Rand/Dollar exchange rate (Q4 avg.) ('R) 8.67 8.98 8.97 8.86 Rand/Euro exchange rate (Q4 avg.) ('R) 11.32 12.18 12.16 12.00 Prime rate (year-end) (%) 8.5 8.5 9.5 10.0 SA 10 YR bond yield (Q4 avg.) (%) 6.77 7.10 8.1 7.8 FTSE/JSE ALSI (year - end) 39250 44837 49407 53920 Brent oil price (year-end) ($) 111.0 112.0 108.0 100.0
* Estimated New (locally manufactured) PPI **Estimated New CPI
Vunani Securities (Pty) ltd is a registered financial services provider. The above material was produced by one of the companies in the Vunani Group. A Group Company and/or persons connected with it may effect or have effected a transaction for their own account in the investments referred to in the above material or any related investments before the material is published to any Group Company’s customers. A Group Company, persons connected with it and their respective directors and/or representatives and/or employees may have a position in the securities or any related investment and may make a purchase and/or sale, or offer to make a purchase and/or to buy any securities. The information and opinions contained in this document have been compiled or arrived at by the relevant Group Company’s judgment as of the date
upon as authoritative or taken in substitution for the exercise of judgment by any recipient. No Group Company accepts any liability whatsoever for any direct or consequential loss arising from any use of this document or its contents.