
SLIDE 1
Solar Energy on the Farm
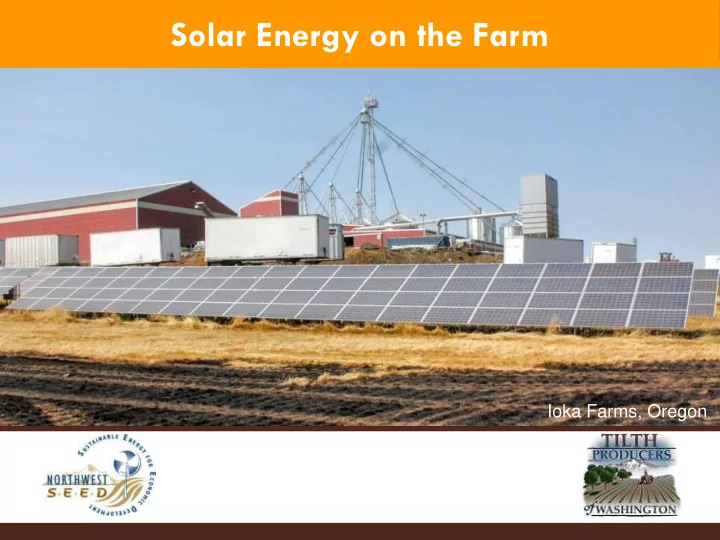
Ioka Farms, Oregon
Solar Energy on the Farm Ioka Farms, Oregon About Northwest SEED - - PowerPoint PPT Presentation
Solar Energy on the Farm Ioka Farms, Oregon About Northwest SEED Technical Assistance Education Policy Advocacy Practical Implementation Outline Solar technology Solar economics Lunch Solar tour General tour Rents Due
Ioka Farms, Oregon
Solar technology Solar economics Lunch Solar tour General tour
Photo Credit: PCC Natural Markets Photo Credit: Fire Mountain Solar
Increased winter precipitation, flooding, soil erosion Longer dry season, drought stress Warmer temperatures, heat stress Lack of cooling days for fruit crops, early budding Increased pests, weeds, and diseases Increased forest fires, worsened air quality
Winter Spring Summer Fall
Adjust timing of planting Modify crop varieties Diversify crops grown Transition to new crops Efficient irrigation techniques
Source: “The Washington Climate Change Impacts Assessment: Evaluating Washington’s Future in a Changing Climate.” The Climate Impacts Group, University of Washington, June 2009.
Reduce tillage Improve nitrogen fertilization efficiency Capture methane emissions from manure Decrease energy consumption Increase renewable energy generation
Source: “Northwest Climate Assessment Report: Implications for Our Landscapes, Waters, and Communities.” Island Press, 2013. http://cses.washington.edu/db/pdf/daltonetal678.pdf
No air or water pollution No water consumption Efficient transmission Energy independence Reduced/stable utility bills Diversify farm revenue Marketing opportunities Supports local economy
Solar Photovoltaics (PV) Solar Hot Water Micro Hydro Wind Energy Solar Hot Air Methane Digesters
WSU Energy Office
NRCS Mt Vernon Service Center
Puget Sound Energy
SnoPUD http://www.snopud.com/conservation.ash
Designed & installed on-grid, off-grid and grid-tied battery-
Assisted 5 businesses with USDA grants in 2015-2016
LOCAL: Rents Due Ranch, Camano Coffee Roasters, Orchards
installed 22KW USDA grant project in Sunnyside
Designs solar, helps with USDA application, handles all utility
Family-owned business located outside Mt Vernon.
Photovoltaic (PV) = Solar Electricity Watt (W) = instantaneous measure of power
Like your speedometer Kilowatt (kW) = 1000 W
Kilowatt-hour (kWh) = amount of energy produced
Like your odometer 1 kW used or produced for 1 hour = 1 kWh
Average U.S. home uses about 12,000 kWh/year 1 kW of PV produces about:
1,000 kWh/year in Seattle 1,300 kWh/year in Yakima
Roof in good condition = Good! Facing South, East, or West = Good!
Lots of shade = Not Good Future shade = Not Good
Pole-mounted Ground-mounted
Pinehold Gardens, Wisconsin Greenbank Farm, Whidbey Island, Washington
Picnic Shelters Awning
Jefferson Park, Seattle, WA (source: Seattle City Light) Bellingham
Budget Roof shading /
Roof space Electric bill offset
Solar data source: LBNL “Tracking the Sun VII”, systems up to 10 kW in size.
Note: The costs shown are approximate; actual costs for your situation will depend on a number of factors and will be determined after a site visit.
Electric service System size Multiple arrays Type of solar module If roof-mounted: Roof slope and height Type of roof shingles Structural issues
Micro inverters Monitoring system Maintenance contract Extended equipment
Length of workmanship
No sales tax on systems up to 10kW Solar Federal Tax Credit = 30% of project cost Washington Solar Production Incentive Up to $0.15/kWh for out of state panels/inverters Up to $0.54/kWh for Washington panels/inverters Net Metering – avoided purchase of power MACRS (accelerated depreciation for businesses) SnoPUD Solar Express (up to $8,000)
Funding available for clean energy projects Grant = 25% Loan Guarantee = 75% Feasibility study grant = 25% Who Qualifies? Rural small businesses Agricultural producers Contact: Brandon Hoffman, 360.428.4322 x161
USDA REAP Grant (25%) WA SOLAR INCENTIVE (5-10%) FEDERAL TAX CREDIT (30%)
after year one
NET METERING (2-3%) MACRS Depreciation (5-6%)
10 kW system Installed cost = $4.00/Watt for Itek, $3.00/Watt for SolarWorld 10,000 kWh/year production (south-facing roof, no shade) Installed by Dec 31, 2016 0.5% annual degradation in output Inverter replacement cost of $1,000 in Year 15 $0.09/kWh utility rate with 3% annual escalation Owner is eligible for 30% tax credit and MACRS depreciation Owner’s federal tax bracket rate is 34% $0.40/kWh in-state and $0.12/kWh out-of-state incentive,
Owner receives USDA REAP grant reimbursement of 25%
Home of the Solar Cash Flow™ Loan Own your Solar system for about the monthly cost of
Low interest Energy Loans-Rates as low as 3.99% Additional items can be financed (HVAC/Roof/Electrical) No loan origination or prepayment fees Fast Loan Decisions, apply online 24/7 Secured by Solar equipment-no home equity needed Friendly service and personalized decisions
Kaylyn Milligan-Solar Loan Consultant kaylyn@generationscreditunion.com 425-330-9650