Solar and meteo data: reducing uncertainty of solar - - PowerPoint PPT Presentation

solar and meteo data reducing uncertainty of solar energy
SMART_READER_LITE
LIVE PREVIEW

Solar and meteo data: reducing uncertainty of solar - - PowerPoint PPT Presentation

Solar and meteo data: reducing uncertainty of solar energy projects Marcel Suri GeoModel Solar, Slovakia 16 th Renewable Energy Finance Forum Europe


slide-1
SLIDE 1

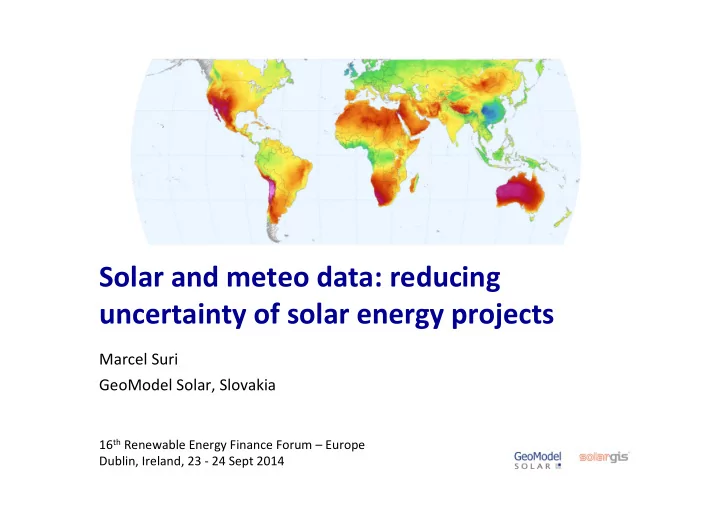
Solar ¡and ¡meteo ¡data: ¡reducing ¡ ¡ uncertainty ¡of ¡solar ¡energy ¡projects ¡

Marcel ¡Suri ¡ GeoModel ¡Solar, ¡Slovakia ¡

16th ¡Renewable ¡Energy ¡Finance ¡Forum ¡– ¡Europe ¡ Dublin, ¡Ireland, ¡23 ¡-­‑ ¡24 ¡Sept ¡2014 ¡

slide-2
SLIDE 2

About ¡GeoModel ¡Solar ¡

Development ¡and ¡operaGon ¡of ¡SolarGIS ¡online ¡system ¡

  • Solar ¡resource ¡and ¡meteo ¡database ¡
  • PV ¡soLware ¡
  • Data ¡services ¡for ¡PV: ¡planning, ¡monitoring, ¡forecasGng ¡

¡ Consultancy ¡and ¡expert ¡services ¡ ¡

  • Solar ¡resource ¡assessment ¡
  • PV ¡yield ¡and ¡performance ¡assessment ¡
  • Strategy ¡studies ¡and ¡trainings ¡

16th ¡REFF ¡EUROPE, ¡Dublin, ¡23-­‑24 ¡Sept ¡2014 ¡ 2 ¡

70+ ¡countries ¡ 400+ ¡consultancy ¡assignments ¡in ¡solar ¡energy ¡ Major ¡technical ¡advisors ¡& ¡industrial ¡partners ¡ World ¡bank ¡and ¡governmental ¡agencies ¡

slide-3
SLIDE 3

GeoModel ¡Solar: ¡History ¡

16th ¡REFF ¡EUROPE, ¡Dublin, ¡23-­‑24 ¡Sept ¡2014 ¡ 3 ¡

PVGIS ¡ Research ¡and ¡demonstraGon ¡project ¡ PromoGon ¡of ¡PV ¡in ¡Europe ¡ ¡ by ¡European ¡Commission, ¡ Joint ¡Research ¡Centre ¡ SolarGIS ¡ Commercial ¡database ¡and ¡soLware ¡ Focus ¡on ¡industry ¡needs ¡ ¡ by ¡GeoModel ¡Solar ¡

2001 ¡ 2002 ¡ 2003 ¡ 2004 ¡ 2005 ¡ 2006 ¡ 2007 ¡ 2008 ¡ 2009 ¡ 2010 ¡ 2011 ¡ 2012 ¡ 2014 ¡ 2013 ¡

slide-4
SLIDE 4

Why ¡(good) ¡solar ¡and ¡meteo ¡data ¡is ¡needed ¡ ¡

Solar ¡energy ¡technology ¡depends ¡on ¡geographical ¡condiGons: ¡

  • Solar ¡resource ¡– ¡fuel ¡for ¡power ¡plants ¡
  • Weather ¡determines ¡operaGng ¡condiGons ¡
  • Temperature, ¡humidity, ¡wind ¡
  • Other ¡geographical ¡condiGons ¡
  • Terrain, ¡land ¡use, ¡proximity ¡to ¡sea, ¡polluGon ¡

¡

16th ¡REFF ¡EUROPE, ¡Dublin, ¡23-­‑24 ¡Sept ¡2014 ¡ 4 ¡

Solar ¡resource ¡ Air ¡temperature ¡ Terrain ¡

Annual ¡power ¡producGon ¡ from ¡the ¡same ¡PV ¡system: ¡ ¡ 1620 ¡kWh/kWp ¡ ¡ 1543 ¡kWh/kWp ¡ ¡

slide-5
SLIDE 5

Why ¡(good) ¡solar ¡and ¡meteo ¡data ¡is ¡needed ¡ ¡

Solar ¡energy ¡technology ¡depends ¡on ¡geographical ¡condiGons: ¡

  • Solar ¡resource ¡– ¡fuel ¡for ¡power ¡plants ¡
  • Weather ¡determines ¡operaGng ¡condiGons ¡
  • Temperature, ¡humidity, ¡wind ¡
  • Other ¡geographical ¡condiGons ¡
  • Terrain, ¡land ¡use, ¡proximity ¡to ¡sea, ¡polluGon ¡

¡

16th ¡REFF ¡EUROPE, ¡Dublin, ¡23-­‑24 ¡Sept ¡2014 ¡ 5 ¡

Solar ¡resource ¡ Air ¡temperature ¡ Terrain ¡

Annual ¡power ¡producGon ¡ from ¡the ¡same ¡PV ¡system: ¡ ¡ 1620 ¡kWh/kWp ¡ ¡ 1543 ¡kWh/kWp ¡ ¡

slide-6
SLIDE 6

Solar ¡resource ¡data: ¡historical ¡approaches ¡

Data ¡available ¡for ¡Europe ¡

  • NASA, ¡Meteonorm, ¡Satel-­‑light, ¡PVGIS, ¡etc. ¡
  • NaGonal ¡databases: ¡Met ¡Office, ¡DWD, ¡Meteo ¡France, ¡etc. ¡

¡ Benefits ¡ ¡

  • Data ¡were ¡available ¡
  • Some ¡available ¡for ¡free ¡
  • MulGple ¡sources ¡used ¡for ¡risk ¡assessment ¡

16th ¡REFF ¡EUROPE, ¡Dublin, ¡23-­‑24 ¡Sept ¡2014 ¡ 6 ¡

slide-7
SLIDE 7

Solar ¡resource ¡data: ¡historical ¡approaches ¡

Discrepancy ¡between ¡various ¡data ¡sources: ¡GHI ¡up ¡±12% ¡

16th ¡REFF ¡EUROPE, ¡Dublin, ¡23-­‑24 ¡Sept ¡2014 ¡ 7 ¡ Source: ¡Suri ¡et ¡al ¡2008 ¡

slide-8
SLIDE 8

Solar ¡resource ¡data: ¡historical ¡approaches ¡

Shortcomings ¡of ¡tradiNonal ¡databases ¡

16th ¡REFF ¡EUROPE, ¡Dublin, ¡23-­‑24 ¡Sept ¡2014 ¡ 8 ¡ Source: ¡Suri ¡et ¡al ¡2008 ¡

  • Low ¡spaGal ¡and ¡temporal ¡resoluGon ¡
  • Limited ¡accuracy ¡
  • Regional ¡availability ¡
  • Limited ¡technical ¡support ¡
  • No ¡or ¡only ¡occasional ¡data ¡update ¡
  • Limited ¡quality ¡assessment ¡(some ¡database ¡cannot ¡be ¡quality-­‑checked) ¡

¡

slide-9
SLIDE 9

Bankable ¡solar ¡resource ¡data ¡ ¡

Based ¡on ¡the ¡best-­‑available ¡approaches ¡− ¡satellite ¡and ¡ground ¡ Validated ¡and ¡independently ¡tested ¡− ¡known ¡uncertainty ¡ Consistent ¡in ¡Gme ¡and ¡space ¡over ¡vast ¡geographies: ¡

§

Project ¡planning ¡ SystemaGcally ¡updated: ¡

§

System ¡monitoring ¡ ¡

§

Performance ¡assessment ¡

§

ForecasNng ¡ Supported ¡in ¡longterm ¡ ¡ SystemaGc ¡control ¡of ¡data ¡quality ¡

16th ¡REFF ¡EUROPE, ¡Dublin, ¡23-­‑24 ¡Sept ¡2014 ¡ 9 ¡

slide-10
SLIDE 10

Measuring ¡solar ¡resource ¡data ¡

16th ¡REFF ¡EUROPE, ¡Dublin, ¡23-­‑24 ¡Sept ¡2014 ¡ 10 ¡

  • 1. ¡Ground ¡measurements ¡
  • Pyranometers ¡
  • Installed ¡at ¡the ¡power ¡plant ¡
  • 2. ¡Satellite-­‑based ¡solar ¡models ¡
  • Input: ¡satellite ¡& ¡atmospheric ¡data ¡
  • Data ¡are ¡available ¡globally ¡
slide-11
SLIDE 11

Why ¡they ¡are ¡used ¡ Challenges ¡

  • High ¡frequency ¡measurements ¡
  • High ¡accuracy ¡(if ¡properly ¡managed) ¡
  • ProspecGon ¡of ¡new ¡sites ¡
  • Monitoring ¡of ¡power ¡plants ¡

¡ ¡ ¡ ¡ ¡ ¡ ¡ ¡

  • Regular ¡cleaning ¡and ¡calibraGon ¡
  • Management ¡of ¡missing ¡data ¡
  • Data ¡quality ¡control ¡
  • Resource ¡demanding ¡operaGon ¡
  • Longterm ¡sustainability ¡for ¡ ¡

a ¡porjolio ¡is ¡challenge ¡ ¡

Ground ¡measurements ¡

16th ¡REFF ¡EUROPE, ¡Dublin, ¡23-­‑24 ¡Sept ¡2014 ¡ 11 ¡

slide-12
SLIDE 12

Ground ¡instruments: ¡theoreNcal ¡uncertainty ¡

Concentrated ¡solar ¡power ¡and ¡Concentrated ¡PV ¡

  • Pyrheliometer: ¡±1% ¡
  • RotaGng ¡Shadowband ¡Radiometer: ¡±3 ¡to ¡±4%* ¡

¡ ¡ ¡ Photovoltaics ¡

  • Pyranometer: ¡secondary ¡standard: ¡±2% ¡

16th ¡REFF ¡EUROPE, ¡Dublin, ¡23-­‑24 ¡Sept ¡2014 ¡ 12 ¡

UncertainNes: ¡daily ¡summaries, ¡at ¡95% ¡confidence ¡level ¡in ¡laboratory ¡condiGons. ¡

In ¡real ¡condiNons ¡uncertainty ¡is ¡higher ¡and ¡depends ¡on ¡operaNon ¡and ¡ maintenance ¡pracNces ¡

* ¡ALer ¡post ¡processing ¡ ¡

slide-13
SLIDE 13

Issues ¡in ¡ground ¡measurements ¡

  • Unclean ¡instruments ¡
  • Missing ¡data ¡
  • Time ¡shiL ¡
  • UnrealisGc ¡values ¡ ¡
  • Shading ¡
  • Misaligned ¡and ¡miscalibrated ¡sensors ¡

16th ¡REFF ¡EUROPE, ¡Dublin, ¡23-­‑24 ¡Sept ¡2014 ¡ 13 ¡

Uncertainty ¡strongly ¡depends ¡on ¡operaNon ¡and ¡maintenance ¡pracNces ¡

slide-14
SLIDE 14

Satellite-­‑based ¡solar ¡resource ¡data ¡

High-­‑resoluGon ¡data ¡available ¡as ¡conGnuous ¡maps ¡globally ¡

  • SpaGal ¡resoluGon: ¡approx. ¡3 ¡to ¡5 ¡km ¡
  • Frequency ¡of ¡measurements: ¡15 ¡and ¡30 ¡minutes ¡

History ¡of ¡12 ¡to ¡20 ¡years ¡ Lower ¡instantaneous ¡accuracy ¡for ¡the ¡point ¡esGmate ¡ Accuracy ¡of ¡aggregated ¡values ¡ ¡ comparable ¡to ¡ground ¡sensors ¡ Stable, ¡no ¡maintenance ¡issues ¡ ¡

16th ¡REFF ¡EUROPE, ¡Dublin, ¡23-­‑24 ¡Sept ¡2014 ¡ 14 ¡

Source: ¡SolarGIS ¡

Data ¡sources: ¡ ¡ EUMETSAT, ¡ECMWF, ¡NOAA ¡

slide-15
SLIDE 15

Satellite ¡data: ¡cloud ¡modelling ¡

  • ¡ ¡Satellite ¡pixel ¡integrates ¡cloud ¡signal ¡ ¡ ¡ ¡ ¡

¡ ¡ ¡from ¡an ¡area ¡~4 ¡km ¡

  • ¡ ¡Ground ¡instrument ¡shows ¡

¡ ¡ ¡a ¡pinpoint ¡measurement ¡ ¡

slide-16
SLIDE 16

GHI: ¡photovoltaics ¡ DNI: ¡concentrated ¡solar ¡

±4.4%* ¡ ±7.7%* ¡

* ¡80% ¡occurrence ¡

Satellite ¡data ¡uncertainty ¡(SolarGIS) ¡

Relevant ¡for ¡project ¡planning: ¡longterm ¡esNmate ¡of ¡energy ¡yield ¡

slide-17
SLIDE 17

¡ ¡Hourly ¡values ¡ ¡ ¡ ¡ ¡ ¡ ¡ ¡ ¡ ¡ ¡Daily ¡ ¡ ¡ ¡ ¡ ¡ ¡ ¡ ¡ ¡ ¡ ¡ ¡ ¡ ¡ ¡Monthly ¡ ¡ ¡ ¡ ¡ ¡ ¡ ¡ ¡ ¡ ¡ ¡ ¡ ¡Yearly ¡ ¡ The ¡uncertainty ¡for ¡ground ¡sensors ¡considers ¡that ¡they ¡are ¡well ¡maintained, ¡calibrated ¡and ¡data ¡are ¡quality ¡controlled ¡

Uncertainty ¡is ¡higher ¡in ¡

  • Coastal ¡zones ¡
  • High ¡mountains ¡
  • UrbanizaGon ¡
  • Tropical ¡climate ¡

Uncertainty ¡of ¡Global ¡Horizontal ¡Irradiance ¡

SatelliYe ¡data ¡accurate ¡for ¡ ¡ the ¡assessment ¡of ¡monthly ¡ ¡ and ¡annual ¡values ¡

slide-18
SLIDE 18

User’s ¡uncertainty ¡– ¡longterm ¡esNmate ¡

Model uncertainty Uncertainty

  • f the model and

measurements Annual value GHI DNI GHI DNI

  • Uncert. of instruments*
  • 2.0

1.0 Number of sites 189 134 189 134 Standard deviation 3.0 6.0 3.6 6.0 Uncertainty (probability

  • f occurrence)

80% P90 3.9 7.6 4.4 7.7 90% P95 5.0 9.8 5.4 9.9 95% P97.5 5.9 11.7 6.3 11.7 99% P99.5 7.8 15.4 8.1 15.4

* ¡Vuilleumier ¡et ¡al., ¡2014. ¡Performance ¡evaluaGon ¡of ¡radiaGon ¡sensors ¡for ¡the ¡solar ¡energy ¡sector. ¡ ¡ ¡ ¡ ¡MACC–II ¡OSC, ¡Brussels. ¡

SolarGIS ¡global ¡performance: ¡esGmate ¡of ¡yearly ¡GHI ¡and ¡DNI ¡

slide-19
SLIDE 19

Interannual ¡variability ¡

Solar ¡weather ¡can ¡change ¡year-­‑by-­‑year ¡ ¡ in ¡the ¡range ¡of ¡more ¡than ¡±10% ¡ ¡

16th ¡REFF ¡EUROPE, ¡Dublin, ¡23-­‑24 ¡Sept ¡2014 ¡ 19 ¡

Global ¡Horizontal ¡IrradiaGon ¡ ¡ average ¡1994 ¡-­‑ ¡2013 ¡ GHI ¡2013 ¡ GHI ¡2012 ¡ GHI ¡2011 ¡

slide-20
SLIDE 20
  • Improved ¡accuracy ¡of ¡satellite-­‑based ¡data ¡by ¡ground ¡measurements ¡
  • High ¡quality, ¡validated ¡data ¡

Combined ¡use ¡of ¡ground ¡and ¡satellite ¡data ¡ ¡

Ground ¡measurements ¡ Satellite ¡data ¡

slide-21
SLIDE 21
  • Improved ¡accuracy ¡of ¡satellite-­‑based ¡data ¡by ¡ground ¡measurements ¡
  • High ¡quality, ¡validated ¡data ¡

Combined ¡use ¡of ¡ground ¡and ¡satellite ¡data ¡ ¡

Mean ¡Bias ¡ RMSD ¡ KSI ¡ ¡ ¡ ¡ ¡ ¡ ¡ Hourly ¡ Daily ¡ Monthly ¡ ¡ ¡ ¡ ¡ W/m2 ¡ % ¡ % ¡ % ¡ % ¡ ¡ ¡ DNI ¡original ¡

  • ­‑23.7 ¡
  • ­‑4.1 ¡

22.6 ¡ 15.9 ¡ 7.2 ¡ 186 ¡ DNI ¡adapted ¡ ¡ 3.4 ¡ 0.6 ¡ 21.0 ¡ 13.4 ¡ 4.5 ¡ 23 ¡ GHI ¡original ¡ ¡

  • ­‑8.0 ¡
  • ­‑1.8 ¡

11.9 ¡ 5.8 ¡ 2.0 ¡ 46 ¡ GHI ¡adapted ¡ ¡ 0.1 ¡ 0.0 ¡ 11.2 ¡ 4.7 ¡ 1.0 ¡ 17 ¡

DNI ¡ GHI ¡

slide-22
SLIDE 22

CombinaNon ¡of ¡satellite ¡and ¡ground ¡data ¡ reduces ¡uncertainty ¡

16th ¡REFF ¡EUROPE, ¡Dublin, ¡23-­‑24 ¡Sept ¡2014 ¡ 22 ¡

DNI: ¡±4% ¡ GHI: ¡±2.5% ¡

Achievable ¡ ¡ uncertainty ¡ ¡

  • f ¡satellite ¡ ¡

data ¡

slide-23
SLIDE 23

PV ¡performance ¡assessment ¡indicators ¡

  • 1. ¡RaNo ¡between ¡produced ¡electricity ¡and ¡input ¡solar ¡radiaNon: ¡

¡ ¡ ¡ ¡ ¡

  • 2. ¡Comparing ¡expected ¡and ¡real ¡PV ¡power ¡producNon: ¡

¡

16th ¡REFF ¡EUROPE, ¡Dublin, ¡23-­‑24 ¡Sept ¡2014 ¡ 23 ¡

Performance Ratio = PV produced Global radiation PV difference = PV produced PV expected

The ¡data ¡should ¡represent ¡the ¡same ¡period ¡of ¡Nme ¡(e.g. ¡one ¡specific ¡year)! ¡

slide-24
SLIDE 24

PV ¡performance ¡assessment ¡indicators ¡

  • 1. ¡RaNo ¡between ¡produced ¡electricity ¡and ¡input ¡solar ¡radiaNon: ¡

¡ ¡ ¡ ¡ ¡

  • 2. ¡Comparing ¡expected ¡and ¡real ¡PV ¡power ¡producNon: ¡

¡

16th ¡REFF ¡EUROPE, ¡Dublin, ¡23-­‑24 ¡Sept ¡2014 ¡ 24 ¡

Performance Ratio = PV produced Global radiation PV difference = PV produced PV expected

slide-25
SLIDE 25

Using ¡Performance ¡RaNo ¡

Benefits: ¡

  • Simple ¡indicator ¡of ¡efficiency ¡
  • Based ¡on ¡aggregated ¡values ¡

¡ LimitaNons: ¡

  • SensiGve ¡to ¡quality ¡of ¡solar ¡radiaGon ¡data ¡
  • Should ¡be ¡based ¡on ¡strict ¡1:1 ¡comparison ¡
  • Temperature ¡dependent, ¡i.e. ¡geography ¡specific ¡

¡

16th ¡REFF ¡EUROPE, ¡Dublin, ¡23-­‑24 ¡Sept ¡2014 ¡ 25 ¡

slide-26
SLIDE 26

Harmonized ¡performance ¡assessment ¡of ¡mulNple ¡sites ¡ ¡

¡ ¡ ¡ ¡ ¡ ¡ ¡ ¡ ¡ ¡ ¡

16th ¡REFF ¡EUROPE, ¡Dublin, ¡23-­‑24 ¡Sept ¡2014 ¡ 26 ¡

Difference ¡to ¡ ¡ long ¡term ¡average ¡ Monthly ¡solar ¡radiaGon ¡ 07/2014 ¡

slide-27
SLIDE 27

PV ¡performance ¡assessment ¡indicators ¡

  • 1. ¡RaNo ¡between ¡produced ¡electricity ¡and ¡input ¡solar ¡radiaNon: ¡

¡ ¡ ¡ ¡ ¡

  • 2. ¡Comparing ¡expected ¡and ¡real ¡PV ¡power ¡producNon: ¡

¡

16th ¡REFF ¡EUROPE, ¡Dublin, ¡23-­‑24 ¡Sept ¡2014 ¡ 27 ¡

Performance Ratio = PV produced Global radiation PV difference = PV produced PV expected

slide-28
SLIDE 28

PV ¡performance ¡assessment ¡indicators ¡

  • 1. ¡RaNo ¡between ¡produced ¡electricity ¡and ¡input ¡solar ¡radiaNon: ¡

¡ ¡ ¡ ¡ ¡

  • 2. ¡Comparing ¡expected ¡and ¡real ¡PV ¡power ¡producNon: ¡

¡

16th ¡REFF ¡EUROPE, ¡Dublin, ¡23-­‑24 ¡Sept ¡2014 ¡ 28 ¡

Performance Ratio = PV produced Global radiation PV difference = PV produced PV expected

Solar ¡radiaGon ¡ Air ¡temperature ¡ PV ¡system ¡configuraGon ¡ SimulaGon ¡of ¡expected ¡ ¡ PV ¡power ¡output ¡

slide-29
SLIDE 29

Global irradiation (module surface) Air temperature Inverters DC losses Angular reflection Shading by terrain Performance relative to STC AC and transformers Availability, power tolerance

SolarGIS: ¡State-­‑of-­‑the-­‑art ¡ ¡ PV ¡simulaNon ¡models ¡ ¡

Electrical output

snow ¡and ¡polluMon ¡ interrow ¡shading ¡ mismatch, ¡cable ¡ ¡ losses, ¡etc. ¡ ¡

  • Use of high-frequency time series
  • Conversion stages are simulated by

numerical models

  • Snow and surface soiling remain as

empirical parameters

  • Uncertainty for all conversion stages is

known

slide-30
SLIDE 30

Comparing ¡expected ¡and ¡real ¡PV ¡power ¡ producNon ¡

Benefits: ¡

  • More ¡accurate ¡
  • Straight ¡comparison ¡of ¡energy ¡values ¡
  • High ¡resoluGon ¡– ¡small ¡issues ¡can ¡be ¡idenGfied ¡

¡ LimitaNons: ¡

  • Models ¡are ¡not ¡perfect ¡

¡

16th ¡REFF ¡EUROPE, ¡Dublin, ¡23-­‑24 ¡Sept ¡2014 ¡ 30 ¡

slide-31
SLIDE 31

Performance ¡benchmarking ¡of ¡PV ¡power ¡plants ¡

16th ¡REFF ¡EUROPE, ¡Dublin, ¡23-­‑24 ¡Sept ¡2014 ¡ 31 ¡

slide-32
SLIDE 32

Management ¡of ¡pordolio ¡worldwide ¡ ¡

  • Data ¡are ¡available ¡globally ¡
  • Harmonized ¡approach ¡
  • High ¡accuracy, ¡availability ¡and ¡reliability ¡

16th ¡REFF ¡EUROPE, ¡Dublin, ¡23-­‑24 ¡Sept ¡2014 ¡ 32 ¡

slide-33
SLIDE 33

Conclusions ¡

Combined ¡use ¡of ¡satellite ¡data ¡and ¡ground ¡measurements ¡

  • Project ¡planning ¡
  • Performance ¡assessment ¡

¡ Benefits ¡

  • Highest ¡possible ¡quality ¡
  • Cost ¡efficient ¡
  • Sustainable ¡in ¡longterm ¡
  • Globally ¡available ¡

16th ¡REFF ¡EUROPE, ¡Dublin, ¡23-­‑24 ¡Sept ¡2014 ¡ 33 ¡