
SLIDE 1
12/24/2014 1
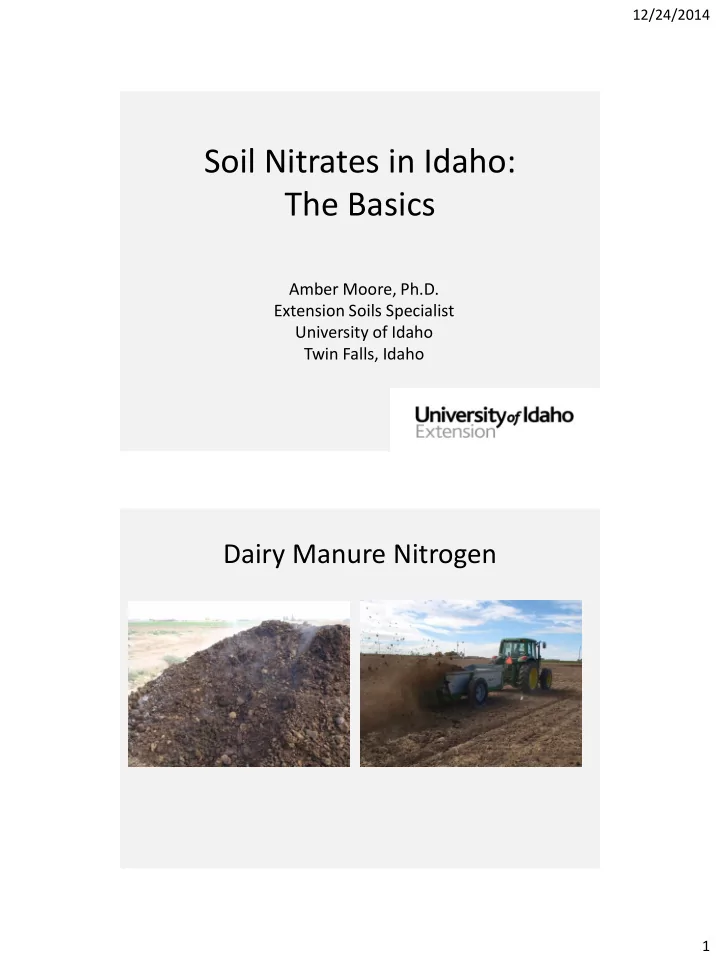
Soil Nitrates in Idaho: The Basics Amber Moore, Ph.D. Extension - - PDF document
12/24/2014 Soil Nitrates in Idaho: The Basics Amber Moore, Ph.D. Extension Soils Specialist University of Idaho Twin Falls, Idaho Dairy Manure Nitrogen 1 12/24/2014 Manure and Lignin Cattle manure contains significantly more lignin
12/24/2014 1
12/24/2014 2
Substrate Lignin Wheat straw 8.9 Cow manure 8.1 Chicken manure 3.4 Pig manure 2.2
Adapted from Cornell University Composting Website: http://compost.css.cornell.edu/lignin.table.html Accessed on December 3, 2014
12/24/2014 3
Animal species Amino acid Urea Ammonium Uric acid Other (Stable
compounds) Poultry 27 4 8 61 1 Beef 20 35 0.5 44 Dairy 23 28 0.5 49 Swine 27 51 0.5 22
Excerpt from Gale, E.S., D.M. Sullivan, C.G. Cogger, A.I. Bary, D.D. Hephill and E.A.
12/24/2014 4
5 10 15 20 25 30 35 40 45 50 55 30 60 90 120
Soil Nitrate (ppm)
Camas Barley Field, 2010
Control 5 ton Compost/acre 10 ton Compost/acre
(Day 0 = mid-May, Day 120 = mid-September)
Nitrogen mineralization after one fall application to an organic dryland barley field in Camas County, Idaho. (unpublished data: Falen, Hunter, Kinder, and Moore)
(Graybill and Moore, unpublished)
12/24/2014 5
5 10 15 20 25 30 35 40 45 50 Soil nitrate (ppm) Moore, A.D., N.L. Olsen, A.M. Carey, and A.B. Leytem. 2011. Residual effects of fresh and composted dairy manure application on potato production. American Potato Journal of
a a b
12/24/2014 6
5 10 15 20 25 30 35 40 45 50 Soil nitrate (ppm) Moore, A.D., N.L. Olsen, A.M. Carey, and A.B. Leytem. 2011. Residual effects of fresh and composted dairy manure application on potato production. American Potato Journal of
a a b
68 lbs N/acre available as nitrate from past manure applications
Year following a 1-time application Composted dairy manure (12 or 28 dry ton/acre) Stockpiled dairy manure (10 or 20 dry ton/acre)
Lentz, R.D. and Lehrsch, G.A. and Brown, Bradford and Johnson-Maynard, J. and Leytem, A.B. (2011) Dairy Manure Nitrogen Availability in Eroded and Noneroded Soil for Sugarbeet Followed by Small Grains. Agronomy Journal. 103(3):628-642.
12/24/2014 7
5 10 15 20 25 30 35 40 45 50 55 30 60 90 120
Soil Nitrate (ppm)
Camas Barley Field, 2010
Control 5 ton Compost/acre 10 ton Compost/acre 5 10 15 20 25 30 35 40 45 50 55 30 60 90 120
Soil Nitrate (ppm)
Camas Barley Field, 2011
Control 5 ton Compost/acre 10 ton Compost/acre
(Day 0 = mid-May, Day 120 = mid-September)
Nitrogen mineralization after 1 and 2 years of dairy compost fall applications. (unpublished data: Falen, Hunter, Kinder, and Moore)
12/24/2014 8
Chandra, 1962, Canadian Journal of Soil Science 42:314.
12/24/2014 9
5 10 15 20 25 30 35 40 No manure 20 ton/acre 40 ton/acre 60 ton/acre
0--12 inch soil depth 12--24 soil depth
5 10 15 20 25 30 35 40 No manure 20 ton/acre 40 ton/acre 60 ton/acre
0--12 inch soil depth 12--24 soil depth
12/24/2014 10
25 50 75 100 125 150 175 200
Cumulative Soil Plant Available N lb N/acre
54 ton manure/acre 36 ton manure/acre 18 ton manure/acre Fertrilizer Control
Nitrogen mineralization patterns (0-12 inch soil depth) in year 1 of the long-term dairy manure application study. Kimberly, Idaho 2013. Moore, unpublished.
40 45 50 55 60 65 70 75 80 85
Soil temperature (4 inch depth) in 2012, Kimberly, Idaho.
(Data from Agrimet weather database)
12/24/2014 11
Chandra, 1962, Canadian Journal of Soil Science 42:314.
12/24/2014 12
– More liquid usually means more ammonium and readily mineralizeable N – More turning usually means more stable organic N, less ammonium and readily mineralizeable N
– Manure testing – Analyze for moisture, Total N, ammonium, and nitrate – Takes out the guessing
Portneuf Silt Loam Quincy Sand
12/24/2014 13
12/24/2014 14
12/24/2014 15
Meisinger, J.J., V.A. Bandel, J.S. Angle, B.E. O’Keefe, and C.M. Reynolds. 1992. Presidedress Soil Nitrate Test Evaluation in Maryland. Soil Sci. Soc. Am. J. 56:1527-1532.
12/24/2014 16
12/24/2014 17
12/24/2014 18
R² = 0.5715 50 100 150 200 250 300 350 400 100 200 300 400 500 Corn Grain Yield (bu/acre) Soil + Fertilizer N (lb N/acre)
2011 2012 2013
R² = 0.5715 50 100 150 200 250 300 350 400 100 200 300 400 500 Corn Grain Yield (bu/acre) Soil + Fertilizer N (lb N/acre)
2011 2012 2013
12/24/2014 19
R² = 0.9073 50 100 150 200 250 300 350 400 100 200 300 400 500 600 Corn Grain Yield (bu/acre) Soil + Fertilizer N (lb N/acre)
2011 2012 2013
R² = 0.9073 50 100 150 200 250 300 350 400 100 200 300 400 500 600 Corn Grain Yield (bu/acre) Soil + Fertilizer N (lb N/acre)
2011 2012 2013
12/24/2014 20
12/24/2014 21
12/24/2014 22
http://extension.oregonstate.edu/catalog/pdf/em/em8954- e.pdf