
SLIDE 1
Florida Department of Environmental Protection
Alan Baker, P.G. Clint Kromhout, P.G. Harley Means, P.G. Office of the Florida Geological Survey
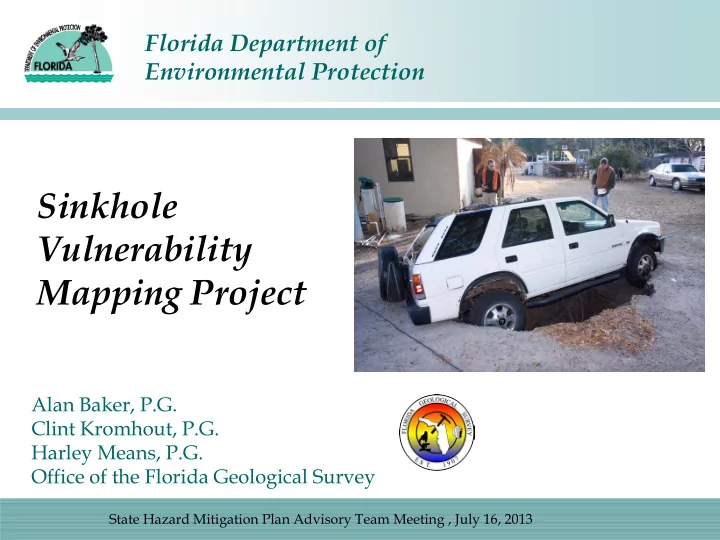
Sinkhole Vulnerability Mapping Project
State Hazard Mitigation Plan Advisory Team Meeting , July 16, 2013