SLIDE 19 19
No · S i z e , P r e s s u r e , T e m p e r a t u r e L i m i t a t i
s · C
p l e x i t y
t h e s y s t e m · C
p a t i b i l i t y · F l e x i b i l i t y · F a c i l i t y u t i l i z a t i
· B a l a n c e
c a p i t a l a n d
e r a t i n g c
t s · C r
s c
t a m i n a t i
· A d s
p t i
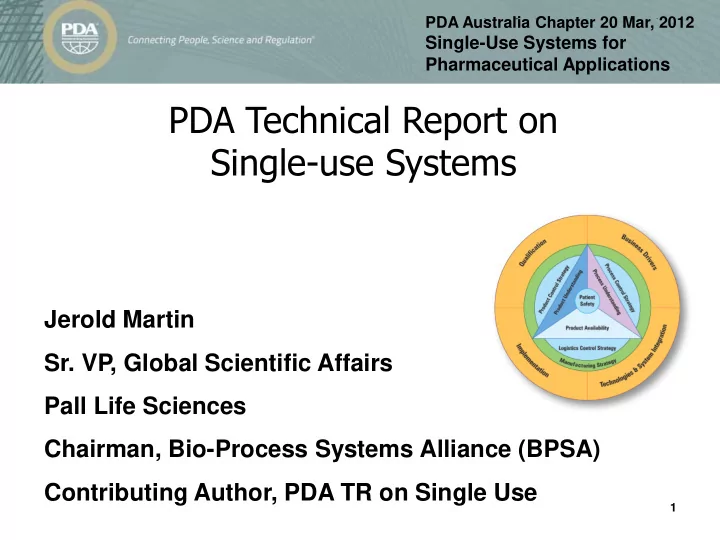
· E x t r a c t a b l e s / L e a c h a b l e s · Regulatory acceptance · System reliability · Internal change acceptance Is SUS Technically Feasible? Implementation Strategy Acceptable? Process Control Strategy Acceptable? Logistic Control Strategy Acceptable? Product Risk Acceptable? Process Risk Acceptable?
SUS is feasible
· S y s t e m I n t e g r i t y L
s · P r
e s s a d j u s t m e n t s · O p e r a t
S a f e t y · Supply · Qualification · Transportation · Process validation · Measurement quality · Process interaction and and
SUS may not be applicable
Business Case Acceptable? and and and and and
Guided Decision Process