Experimental study to detect bubble in bubbly flow using ultrasonic - - PDF document

β–Ά
experimental study to detect bubble in bubbly flow using
SMART_READER_LITE
LIVE PREVIEW

Experimental study to detect bubble in bubbly flow using ultrasonic - - PDF document

Transactions of the Korean Nuclear Society Virtual Spring Meeting July 9-10, 2020 Experimental study to detect bubble in bubbly flow using ultrasonic pulse-echo method Geoseong Na a , Ji-Hwan Park a , Hongrae Jo a , Daeseong Jo a a


slide-1
SLIDE 1

Transactions of the Korean Nuclear Society Virtual Spring Meeting July 9-10, 2020

Experimental study to detect bubble in bubbly flow using ultrasonic pulse-echo method

Geoseong Naa, Ji-Hwan Parka, Hongrae Joa, Daeseong Joaο€ͺ aMechanical Engineering, Kyungpook National Univ., 80 Daehak-ro, Buk-gu, Daegu 41566, Republic of Korea *Corresponding author: djo@knu.ac.kr

  • 1. Introduction

Bubble detection technology has been used in various engineering fields such as the nuclear industry since it affects the system performance. Especially, in the nuclear research reactor, when the boiling [1] occurred at the core, bubbles are formed, and the thermal-hydraulic characteristics such as heat transfer and pressure drop [2, 3] are affected. Therefore, many researchers have attempted bubble detection since the bubble formation affects system performance. In the existing researches, the measurement methods were used to detect the bubble using the various non- intrusive method [4] such as visualization and acoustic

  • method. The visualization method [5] to observe the

bubble behavior directly was used by using a high-speed camera to investigate the mixed air-water flow in the vertical channel. The acoustic method in the vertical channel [6] was used to investigate the bubble rising movement using the ultrasonic apparatus. This author used the multi-wave ultrasonic pulse, the doppler method, and wire mesh tomography. The acoustic method in the horizontal channel [7] was used to identify the two-phase flow pattern using the pulse-echo method. In the existing research, the flow rate of liquid existed. When the constant flow rate of liquid existed, the shape

  • f the bubble was uniform under the constant air flow

rate condition. But under the stationary liquid condition, the shape of bubbles was non-uniform because bubbles were collapsed or split each other. In this paper, therefore, bubbles with non-uniform shape were detected using the ultrasonic apparatus under the bubbly flow regime

  • condition. When the ultrasonic apparatus was used, the

detection of bubbles can be determined by changing the ultrasonic amplitude.

  • 2. Methods and Results

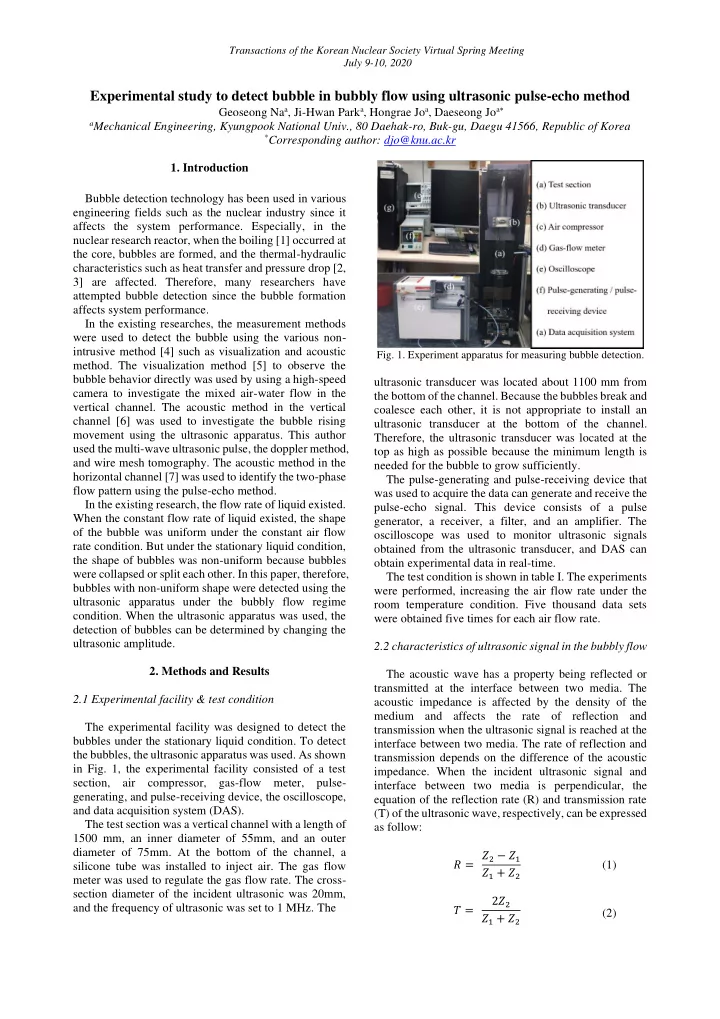
2.1 Experimental facility & test condition The experimental facility was designed to detect the bubbles under the stationary liquid condition. To detect the bubbles, the ultrasonic apparatus was used. As shown in Fig. 1, the experimental facility consisted of a test section, air compressor, gas-flow meter, pulse- generating, and pulse-receiving device, the oscilloscope, and data acquisition system (DAS). The test section was a vertical channel with a length of 1500 mm, an inner diameter of 55mm, and an outer diameter of 75mm. At the bottom of the channel, a silicone tube was installed to inject air. The gas flow meter was used to regulate the gas flow rate. The cross- section diameter of the incident ultrasonic was 20mm, and the frequency of ultrasonic was set to 1 MHz. The

  • Fig. 1. Experiment apparatus for measuring bubble detection.

ultrasonic transducer was located about 1100 mm from the bottom of the channel. Because the bubbles break and coalesce each other, it is not appropriate to install an ultrasonic transducer at the bottom of the channel. Therefore, the ultrasonic transducer was located at the top as high as possible because the minimum length is needed for the bubble to grow sufficiently. The pulse-generating and pulse-receiving device that was used to acquire the data can generate and receive the pulse-echo signal. This device consists of a pulse generator, a receiver, a filter, and an amplifier. The

  • scilloscope was used to monitor ultrasonic signals
  • btained from the ultrasonic transducer, and DAS can
  • btain experimental data in real-time.

The test condition is shown in table I. The experiments were performed, increasing the air flow rate under the room temperature condition. Five thousand data sets were obtained five times for each air flow rate. 2.2 characteristics of ultrasonic signal in the bubbly flow The acoustic wave has a property being reflected or transmitted at the interface between two media. The acoustic impedance is affected by the density of the medium and affects the rate of reflection and transmission when the ultrasonic signal is reached at the interface between two media. The rate of reflection and transmission depends on the difference of the acoustic

  • impedance. When the incident ultrasonic signal and

interface between two media is perpendicular, the equation of the reflection rate (R) and transmission rate (T) of the ultrasonic wave, respectively, can be expressed as follow: 𝑆 = π‘Ž2 βˆ’ π‘Ž1 π‘Ž1 + π‘Ž2 (1) π‘ˆ = 2π‘Ž2 π‘Ž1 + π‘Ž2 (2)

slide-2
SLIDE 2

Table I. Test condition.

Parameter Value volumetric rate of air [𝑛3/𝑑] 3.3 βˆ’ 13.5 Γ— 10βˆ’6 air temperature [℃] 20 water temperature [℃] 20

(a) (b) (c)

  • Fig. 2. The ultrasonic signal in the test section (a) only water

(reference) (b) small bubble (c) large bubble.

Z1 , Z2 is the acoustic impedance of two medium,

  • respectively. When the difference in acoustic impedance

between two-media is small, the reflection rate is small. On the other hand, when the difference in acoustic impedance between two-medium is large, the reflection rate is large. Using this characteristic of ultrasonic, transmitted and returned ultrasonic signal was used to detect the bubble. The behavior of the ultrasonic signal in the test section was shown in Fig. 2 (a). When there was no bubble in the test section, as shown in Fig. 2 (a), most of the ultrasonic signals are transmitted, and little of the ultrasonic signals were reflected at each interface. Because the difference

  • f acoustic impedance between PMMA and water is
  • small. When transmitted ultrasonic signals were reached

to the PMMA-air interface, most of the transmitted signals were returned to the ultrasonic transducer. Because the difference of acoustic impedance between PMMA and air was large. In this case, the ultrasonic amplitude had maximum intensity. When there was bubble in the test section, as shown in Fig. 2 (b), some of the ultrasonic signals were reflected from the gas-liquid

  • interface. The reflected signals from the gas-liquid

interface were not returned to the transducer since there was no flat plane. Some ultrasonic signals were reflected from the opposite wall, as shown in Fig. 2 (a). Since so-

Table II. Acoustic impedance of material

Material Value (𝑄𝑏 𝑑 𝑛 ⁄ ) PMMA 3,205,800 Deionized water 1,477,040 Air 413.31

  • me ultrasonic signals were not returned from the gas-

liquid interface. In this case, the ultrasonic amplitudes were attenuated. When there were large bubbles in the test section, as shown in Fig. 2 (c), all the ultrasonic signals were reflected from the gas-liquid interface, and all the signals were not returned, same reason as above. In this case, the ultrasonic amplitude had minimum value. 2.2.1 Ultrasonic signal analysis In general, a time of flight (TOF) method has been used as an ultrasonic signal analysis method. The TOF method uses to obtain the penetrating time of ultrasonic in media. When the ultrasonic signals are returned from interface to receiver between two media, penetrating time can be calculated. Therefore, the distance between the interface and ultrasonic transducer can be calculated by using penetrating time and velocity of ultrasonic in each medium. Also, the TOF can only be used in the shape of a flat plane interface. However, in this paper, the TOF method cannot be used since the shape of the bubble was the circle. Therefore, since the TOF method cannot be used, the pulse-echo method was used. 2.3 Results and discussion To detect the bubbles, ultrasonic signals obtained from the ultrasonic apparatus were analyzed for each constant air flow rate condition. All experiments for each constant air flow rate were performed five times. These data sets were calculated to be averaged and were displayed to

  • boxplot. In each condition, amplitude data was displayed

to normal distribution to confirm the trend. 2.3.1 Reference result (zero air-flow rate) When the air-flow rate is zero, there was no interface between gas and liquid. Most of the ultrasonic signals were reflected from the opposite channel wall when there was no bubble in the test section. Since there was the interface at PMMA-air, PMMA-water, as shown in Fig. 2 (a). So, all the A5 amplitudes had maximum value in all the data sets. 2.3.2 Two-phase flow (bubbly flow) As shown in Fig. 3, when air flow rate increased, the distribution of A5 amplitude gradually widened, and the center moved to left. These show that when air flow rate increased, the bubble detection frequency increased. Also, the shape of bubbles was various, and the size of bubbles, gradually, was larger. As the results above, it was possible to detect the bubble qualitatively when the

Transactions of the Korean Nuclear Society Virtual Spring Meeting July 9-10, 2020

slide-3
SLIDE 3
  • Fig. 3. Probability distribution of A5 amplitude analyzed by

25000 data sets for each air flow rate.

  • Fig. 4. Result of change of average of A5 amplitude.

air flow rate increased. Also, As shown in Fig. 4, it was possible to confirm the trend of the average value of the A5 amplitude for each air flow rate condition as the air flow rate increases.

  • 3. Conclusions

In this study, the change of specific amplitude in the returned ultrasonic signals was used as a detection method in the bubbly flow regime. In this paper, the bubbles were detected by using the ultrasonic signal. The bubble detection and bubble frequency can be calculated by using the specific amplitude from ultrasonic signals in each air flow rate. In further work, using the calculation

  • f void fraction applying the high-speed camera and

amplitude obtained from the ultrasonic, the relation between the void fraction and amplitude will be researched. REFERENCES

[1] Jo, Hongrae, et al. "Experimental studies of condensing vapor bubbles in subcooled pool water using visual and acoustic analysis methods." Annals of Nuclear Energy 110 (2017): 171-185. [2] Collier, John G., et al. Convective boiling and condensation. Clarendon Press, 1994. [3] Pozos, Oscar, et al. "Experimental investigation of air pockets in pumping pipeline systems." Journal of Hydraulic Research 48.2 (2010): 269-273. [4] Jo, Hongrae, et al. "Non-intrusive detection of gas–water interface in circular pipes inclined at various angles." Annals of Nuclear Energy 139 (2020): 107267. [5] Dinh, Tri Bui, et al. "Application of image processing techniques to air/water two-phase flow." Applications of Digital Image Processing XXII. Vol. 3808. International Society for Optics and Photonics, 1999. [6] Nguyen, Tat Thang, et al. "Measurement of bubbly two- phase flow in vertical pipe using multiwave ultrasonic pulsed Dopller method and wire mesh tomography." Energy Procedia 71 (2015): 337-351. [7] Liang, Fachun, et al. "Gas–liquid two-phase flow pattern identification by ultrasonic echoes reflected from the inner wall

  • f a pipe." Measurement Science and Technology 27.3 (2016):

035304. Transactions of the Korean Nuclear Society Virtual Spring Meeting July 9-10, 2020