Simulations of Rubella Vaccination Strategies in China Herbert - - PowerPoint PPT Presentation

simulations of rubella vaccination strategies in china
SMART_READER_LITE
LIVE PREVIEW

Simulations of Rubella Vaccination Strategies in China Herbert - - PowerPoint PPT Presentation

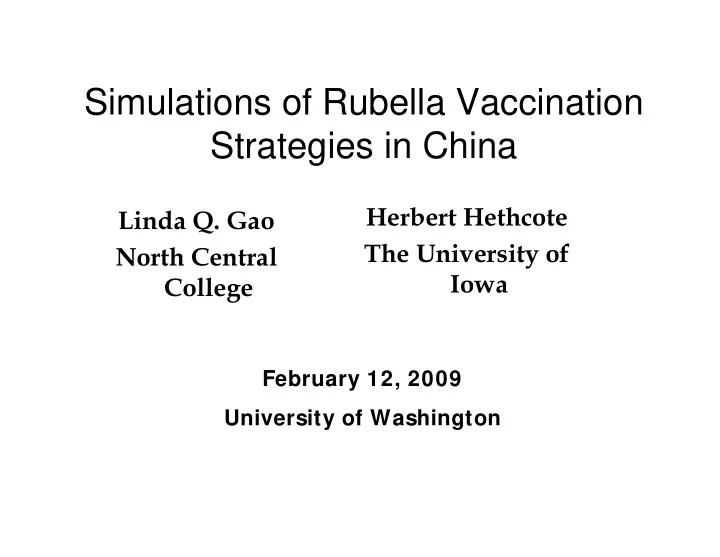
Simulations of Rubella Vaccination Strategies in China Herbert Hethcote Linda Q. Gao The University of North Central Iowa College February 12, 2009 University of Washington References L.Q. Gao and H.W. Hethcote, Simulations of rubella


slide-1
SLIDE 1

Simulations of Rubella Vaccination Strategies in China

Linda Q. Gao North Central College Herbert Hethcote The University of Iowa

February 12, 2009 University of Washington

slide-2
SLIDE 2

References

L.Q. Gao and H.W. Hethcote, Simulations of rubella vaccination strategies in China, Mathematical Biosciences 202 (2006) 371-385. L.Q.Gao and H.W.Hethcote, A mathematical model and projection of various rubella vaccination strategies. Chinese Journal of Vaccines and Immunization 14-3 (2008) 193- 197 (in Chinese with English abstract).

slide-3
SLIDE 3

Background:

  • Rubella: mild childhood infectious disease
  • Congenital Rubella Syndrome: severe

consequences when pregnant women are infected

  • Vaccination status: 1969 – now
  • WHO recommendations on Rubella/CRS

control

slide-4
SLIDE 4

Background :

WHO recommended that “All countries should assess their rubella situation and, if appropriate, make plans for introduction of rubella vaccination and CRS/rubella surveillance.” (Geneva, 2000)

slide-5
SLIDE 5

Warning:

“inadequately implemented childhood

vaccination runs the risk of altering rubella transmission dynamics and increasing susceptibility in women of child bearing age, thereby increasing the risk of CRS” (Geneva, 2000)

slide-6
SLIDE 6

Background: -China

  • Rubella vaccination is not mandatory

in the national immunization program. MMR is available in some major cities.

  • Resources for vaccination are limited.
  • Population structure is changing
  • Should China vaccinate for rubella? If

so, which strategy?

slide-7
SLIDE 7

Wannian Su: Rubella in People’s Republic

  • f China, Rev. Infect Dis 1985; 7:s72
slide-8
SLIDE 8

Method:

Use mathematical models and computer simulations to compare various rubella vaccination strategies with consideration

  • f China’s changing population structure
  • Construct demographical model
  • Add epidemiological model
slide-9
SLIDE 9

China Demographic Model

  • 58 age groups: 0,1,2,…,49, 50-54,

55-59, …, 75-79, 80-84, 85+

  • Interpolate fertility and death rates

using 1987 1% sample data (China statistical yearbook 1997, 1990, 2002) 1992 survey and 2000 census data (China Population Information and Research Center)

slide-10
SLIDE 10

China Demographic Model

  • Derived 1965 age distribution from

1987 age distribution data.

  • Used the birth/death rate from 1965-

1992 as the scaling factor for fertility and death rate.

  • Interpolate fertility and death rate

between 1992 and 2000 data.

  • Used Leslie matrix population model
slide-11
SLIDE 11

Leslie population matrix demographic model ni = size of population in age group i mi = average birth rate of people in age group i Si = fraction of those in age group i who survive to age group i+1

slide-12
SLIDE 12

1990: the model and the data

slide-13
SLIDE 13

2000: the model vs. data

slide-14
SLIDE 14

Growth rate with the size

slide-15
SLIDE 15

The changing age structure of the population:

slide-16
SLIDE 16

M V S E I R

The epidemiological model:

I: infective R: recovered with immunity V: vaccinated M: passively immune S: susceptible E: exposed (latent)

slide-17
SLIDE 17

Parameter values:

  • average passive immunity period is 6

months (182.5 days)

  • average latent period is 10 days
  • average infectious period is 12 days
  • force of infection values: .20 for 0, .24 for

1-4, .27 for 5-9, .15 for 10-14, .10 for 15- 49, .04 for 50-64, .03 for 65+

slide-18
SLIDE 18

Seropositivity: the model vs. data (with no vaccination)

slide-19
SLIDE 19

Rubella cases: no vaccination

slide-20
SLIDE 20

CRS cases: no vaccination

slide-21
SLIDE 21

Why ?

  • Changing demographics => average

age of infection increases => more rubella in pregnant women.

  • Average CRS in 2020-2050 is over

two times the level in 2005

  • Thus maintaining current policy will

lead to more CRS

slide-22
SLIDE 22

Vaccination Strategies

  • Routine vaccination: 1 year old children
  • Routine vaccination: 12 year old girls
  • Mass campaign: 2-14 year old children
  • Mass campaign: 2-14 year old girls
  • Mass campaign: 15-40 year old women
  • Combinations of above
slide-23
SLIDE 23

Rubella cases:

slide-24
SLIDE 24

CRS cases:

slide-25
SLIDE 25

Increasing age of attack:

slide-26
SLIDE 26

Results from simulations:

  • Routine vaccination of 1 year old children

causes rubella incidence to decrease

  • CRS incidence increases unless 50% or more

are vaccinated.

  • Rubella and CRS will be eliminated if 80% or

more are vaccinated (assuming the current population control policy continues).

slide-27
SLIDE 27

Rubella: vaccinate 12 year old girls

slide-28
SLIDE 28

CRS:vaccinate 12 years old girls

slide-29
SLIDE 29

Observations:

  • Routine vaccination of 12 year old girls are

effective in reducing CRS cases

  • This strategy will never lead to elimination
  • f rubella.
slide-30
SLIDE 30

Table 1. Comparison of rubella vaccination strategies in China in 2005 to 2051

198,783,609 198,783,609 13,701 419,181 30% 132,522,406 132,522,406 13,143 413,971 20% 265,044,813 265,044,813 13,910 406,976 40% 66,261,203 66,261,203 12,307 399,712 10% 11,389 380,741 18,417 331,306,016 331,306,016 12,453 362,752 50% 6,395 139,799,268 139,799,268 11,387 358,881 50% 6,403 223,678,829 223,678,829 11,386 345,807 80% 4,276 227,438,932 227,438,932 10,656 327,554 90% 90% 1,407 109,850,973 109,850,973 11,015 302,672 90% 3,831 397,567,219 397,567,219 8,139 276,978 60% 1,174 273,822,196 273,822,196 2,837 147,426 80% 1,171 308,049,970 308,049,970 1,722 117,601 90% 1,658 463,828,423 463,828,423 2,247 100,970 70% 1,500 530,089,627 530,089,627 1 27,308 80% 1,657 596,350,830 596,350,830 20,757 90% 1,918 706,201,803 109,850,973 596,350,830 12,613 90% 90% 2,126 792,069,804 195,718,976 596,350,828 8,173 90% 70% 2,198 823,789,760 227,438,932 596,350,828 5,923 90% 90% 90% 2,329 873,960,925 277,610,095 596,350,830 5,515 90% 60% 90% 2,622 991,548,883 395,198,054 596,350,829 2,578 90% 60% 90% 90%

prevented vaccinations vaccinations vaccinations 2051 2005- 2051 girls children wome boys girls per CRS case total # of # of mass # of routine in Cases 12 yr 1 yr old 15-40 2-14 yr 2-14 yr # of vaccinations CRS total CRS routine: routine: mass: mass: mass:

slide-31
SLIDE 31

Results from simulations:

  • If the achievable vaccination rate is not high,

vaccinating 12 year old girls reduces CRS cases by direct protection.

  • If the achievable vaccination rate is high,

vaccinating 1 year old children is a better strategy that leads to elimination of the disease

  • The threshold for switching is about 80%
slide-32
SLIDE 32

Rubella: 2005 Mass campaign + …

slide-33
SLIDE 33

CRS: 2005 mass campaign + …

slide-34
SLIDE 34

Rubella: Campaign vaccination of 2-14 yr olds in 2005

slide-35
SLIDE 35

CRS: Campaign vaccination of 2-14 yr olds in 2005

slide-36
SLIDE 36

Observations:

  • A mass campaign of vaccinating 15-40

year old women can reduce CRS cases during the following 10-20 years.

  • A mass campaign of vaccinating 2-14 year
  • ld children only can lead to large
  • scillations in CRS cases with peaks

above the no-vaccination levels.

slide-37
SLIDE 37

Conclusion (1) :

The changes in demographic structure are altering rubella transmission

  • dynamics. “No vaccination” or “Low

coverage infant vaccination” are not good strategies for China.

slide-38
SLIDE 38

Conclusion (2):

The best strategy seems to be a combination of initial mass vaccination to provide good short term direct protection plus routine vaccination of at least 80% of 1 year old children to move towards elimination of rubella in China.