
SLIDE 1
Suraj Ketan Samal Upasana Nayak
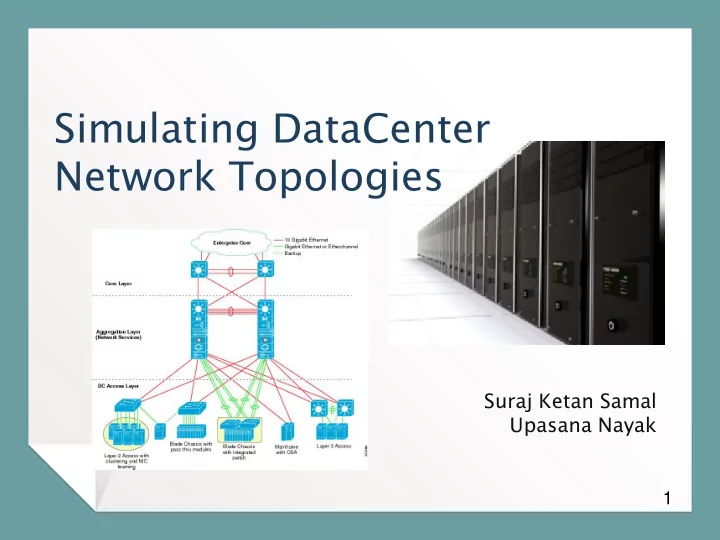
Simulating DataCenter Network Topologies
1
Simulating DataCenter Network Topologies Suraj Ketan Samal Upasana - - PowerPoint PPT Presentation
Simulating DataCenter Network Topologies Suraj Ketan Samal Upasana Nayak 1 Agenda Data Center Networks (DCN) Project Proposal (Our Work) Network Topologies & Properties Simulation using NS-3 Conclusion and Future Work 2
Suraj Ketan Samal Upasana Nayak
1
2
■ A pool of interconnected resources that serve the internet. ■ Recent years have seen huge growth in data transfer especially due to multimedia, big-data and high speed internet. ■ Projected growth is ~23% per year ■ Managing data is inevitable and extremely challenging.
A Google Data Center
Courtesy : http://www.cse.wustl.edu/~jain/cse570-13/ftp/m_03dct.pdf
Cisco Global Cloud Index, 2013-2018 3
Important Challenges
■ Usually consists of three layers – core, aggregation and access ■ Nodes are connected using a interconnection network topology like FatTree, Flattened Butterfly
■ Topology is an important factor responsible for the challenges
4
5
■ FatTree ■ BCube ■ Flattened ButterFly ■ HyScale 6
7
FatTree /4 (n= number of groups/pods) k+1 BCube (n = number of servers connected in basic unit, k= recursion depth) 4 HyScale (a = number of servers connected at each node, k= recursion depth, T = number of nodes in base model) 4k+2
■FatTree ■ Average disjoint paths ■Flattened ButterFly ■ Average Hop Count 8
9
An Example Topology ns-3 Architecture 10
11
Simulation Parameters Fat-Tree BCube HyScale
Simulation Time
100sec 100sec 100sec
PacketSize
1024bytes 1024bytes 1024bytes
DataRates between switches
1Mbps 1Mbps 1Mbps
DataRates between switches and hosts
1000Mbps 1000Mbps 1000Mbps
Communication Pattern
Random selection
sending data between them Random selection of two hosts and sending data between them Random selection of two hosts and sending data between them
Traffic Flow Pattern
Exponential Random Exponential Random Exponential Random
Routing Protocol
Nix-vector(ns-3) Nix-vector(ns-3) Nix-vector(ns-3)
Animator
NetAnim NetAnim NetAnim
Variable parameter(refer to Slide 7)
n varied (2-12) k=2, n varied(2-12) a=2, T=8, k varied from (1-3)
12
Observed Packet loss with exponential random traffic pattern. Observed Average Throughput and Average Delay with exponential random traffic pattern.
13
14
[1] Cisco Global Cloud Index: Forecast and Methodology, 2013–2018. Retrieved from https://www.cisco.com/c/en/us/solutions/collateral/service-provider/global- cloud-index-gci/Cloud_Index_White_Paper.pdf [2] Bilal, Kashif, et al. "Quantitative comparisons of the state‐of‐the‐art data center architectures." Concurrency and Computation: Practice and Experience 25.12 (2013): 1771-1783. [3] Bilal, Kashif, Samee Ullah Khan, and Albert Y. Zomaya. "Green Data Center Networks: Challenges and Opportunities." Frontiers of Information Technology (FIT), 2013 11th International Conference on. IEEE, 2013 [4] Saha, S., Deogun, J. S., & Xu, L. (2012, June). Hyscale: A hybrid optical network based scalable, switch-centric architecture for data centers. InCommunications (ICC), 2012 IEEE International Conference on (pp. 2934- 2938). IEEE.
15
[5] D. Wong, K.T. Seow, C.H. Foh and R. Kanagavelu, “Towards Reproducible Performance Studies of Datacenter Network Architectures Using An Open- Source Simulation Approach”, Proceedings of the IEEE Global Communications Conference (GLOBECOM’13), December 2013, Atlanta, GA, USA. [6] NS3-manual. At https://www.nsnam.org/docs/release/3.11/manual/ns-3- manual.pdf [7] NS3-Tutorial. At https://www.nsnam.org/docs/release/3.22/tutorial/singlehtml/ [8] NTU-DSI-DCN Project. At http://ntu-dsi-dcn.github.io/ntu-dsi-dcn/ [9] Poor man’s tool to support Computer Networking. At www.netkit.org
16
17