
SLIDE 1
2/27/2017
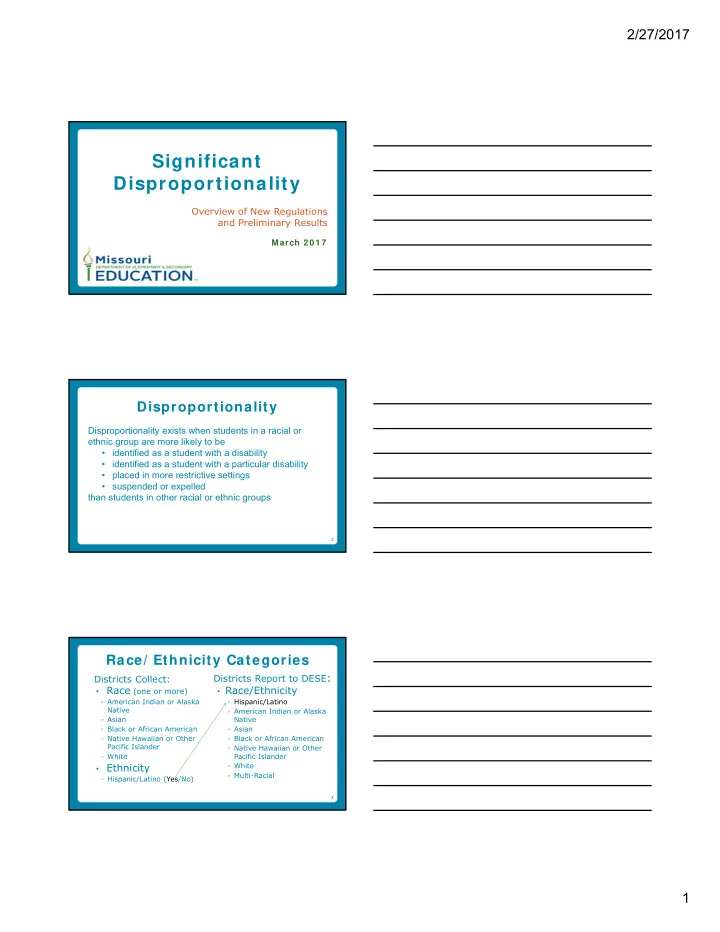
Significant Disproportionality
Overview of New Regulations and Preliminary Results
March 2 0 1 7
Disproportionality
2
Disproportionality exists when students in a racial or ethnic group are more likely to be
- identified as a student with a disability
- identified as a student with a particular disability
- placed in more restrictive settings
- suspended or expelled
than students in other racial or ethnic groups
Race/ Ethnicity Categories
- Race (one or more)
- American Indian or Alaska
Native
- Asian
- Black or African American
- Native Hawaiian or Other
Pacific Islander
- White
- Ethnicity
- Hispanic/Latino (Yes/No)
- Race/Ethnicity
- Hispanic/Latino
- American Indian or Alaska
Native
- Asian
- Black or African American
- Native Hawaiian or Other
Pacific Islander
- White
- Multi-Racial
3