Sharman Branch E W Washington County, MD 1.8 Lowest Reach 1.6 - - PowerPoint PPT Presentation

sharman branch
SMART_READER_LITE
LIVE PREVIEW

Sharman Branch E W Washington County, MD 1.8 Lowest Reach 1.6 - - PowerPoint PPT Presentation

S Meander Belt Width = 32.1 ft. Sharman Branch E W Washington County, MD 1.8 Lowest Reach 1.6 2.4 N Team 1 Mapped 4/17/2018 1.4 Feet 2.3 2.3 2.3 0 20 40 X6 X5 X4 2.1 Meander Belt 1.8 2.1 1.8 Width = 52.5 ft. X3 2.2


slide-1
SLIDE 1

2.3 2.0 2.6 2.4 4.5 1.7 2.1 1.9 2.2 2.1 1.8 2.1 1.8 2.3 2.3 2.3 1.6 1.8 1.4 2.4

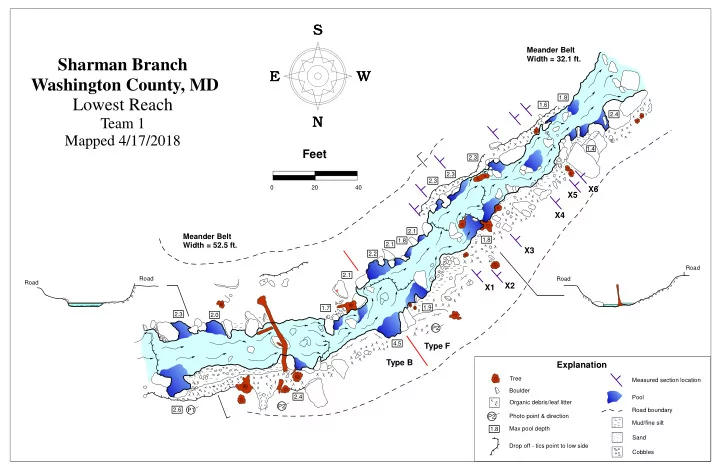
Meander Belt Width = 32.1 ft. Meander Belt Width = 52.5 ft.

Type F Type B

Sharman Branch Washington County, MD Lowest Reach

Team 1 Mapped 4/17/2018

20 40

Feet

N S W E

P1 P2 P2

X1 X2 X3 X4 X5 X6

Road Road Road Road Tree Organic debris/leaf litter P2 Photo point & direction 1.8 Max pool depth Drop off - tics point to low side Measured section location Pool Road boundary Boulder Mud/fine silt Sand Cobbles

Explanation

slide-2
SLIDE 2

Team 1 CS STA 149 Riffle

Ground Points Bankfull Indicators Water Surface Points

Elevation (ft) Horizontal Distance (ft)

90 92 94 96 98 100 10 20 30 40 50 Wbkf = 31.3 Dbkf = 1.46 Abkf = 45.7

slide-3
SLIDE 3

Team 1 CS STA 155 Step

Ground Points Bankfull Indicators Water Surface Points

Elevation (ft) Horizontal Distance (ft)

90 92 94 96 98 100 10 20 30 40 50 Wbkf = 34.1 Dbkf = 1.56 Abkf = 53.2

slide-4
SLIDE 4

Team 1 CS STA 181 Pool

Ground Points Bankfull Indicators Water Surface Points

Elevation (ft) Horizontal Distance (ft)

90 92 94 96 98 10 20 30 40 50 Wbkf = 29.8 Dbkf = 1.96 Abkf = 58.5

slide-5
SLIDE 5

Team 1 CS STA 198 Step

Ground Points Bankfull Indicators Water Surface Points

Elevation (ft) Horizontal Distance (ft)

90 92 94 96 98 100 10 20 30 40 50 60 Wbkf = 30.1 Dbkf = 1.53 Abkf = 45.9

slide-6
SLIDE 6

Team 1 CS STA 198 Step

Ground Points Bankfull Indicators Water Surface Points

Elevation (ft) Horizontal Distance (ft)

90 92 94 96 98 100 10 20 30 40 50 60 Wbkf = 30.1 Dbkf = 1.53 Abkf = 45.9

slide-7
SLIDE 7

Team 1 CS STA 222 Pool

Ground Points Bankfull Indicators Water Surface Points

Elevation (ft) Horizontal Distance (ft)

90 92 94 96 98 100 10 20 30 40 Wbkf = 29.8 Dbkf = 1.81 Abkf = 54.1

slide-8
SLIDE 8

Team 1 CS STA 222 Pool

Ground Points Bankfull Indicators Water Surface Points

Elevation (ft) Horizontal Distance (ft)

90 92 94 96 98 100 10 20 30 40 Wbkf = 29.8 Dbkf = 1.81 Abkf = 54.1

slide-9
SLIDE 9

Team 1 CS STA 232 Riffle

Ground Points Bankfull Indicators Water Surface Points

Elevation (ft) Horizontal Distance (ft)

110

  • 10

10 20 30 40 Wbkf = 28.9 Dbkf = 1.5 Abkf = 43.5

slide-10
SLIDE 10

Longitudinal Profile Team 1 Reach 1

CH WS BKF P1 P2 P3 P4

Elevation (ft) Distance along stream (ft)

88 105 50 100 150 200 250 300 Team 1 CS STA 149 Riffle Team 1 CS STA 155 Step Team 1 CS STA 181 Pool Team 1 CS STA 198 Step Team 1 CS STA 222 Pool Team 1 CS STA 232 Riffle p p p p p p p p r p p r r p p r BKF Best Fit Slope = 0.03200 WS Best Fit Slope = 0.03127

slide-11
SLIDE 11

Representative Pebble Count

Percent Finer Particle Size (mm)

20 40 60 80 100 0.1 1 10 100 1000 10000

slide-12
SLIDE 12

Pebble Count Active Riffle STA 149

Percent Retained Particle Size (mm)

5 10 15 0.50 - 1.0 4.0 - 5.7 8.0 - 11.3 11.3 - 16.0 16.0 - 22.6 22.6 - 32.0 32 - 45 45 - 64 64 - 90 90 - 128 128 - 180 180 - 256 256 - 362 362 - 512 1024 - 2048

slide-13
SLIDE 13

Protrusion 1 STA 149

Percent Retained Particle Size (mm)

5 10 15 20 25 22.6 - 32.0 32 - 45 45 - 64 64 - 90 90 - 128 128 - 180 180 - 256 256 - 362 362 - 512 512 - 1024

slide-14
SLIDE 14

Protrusion STA 149

Percent Finer Particle Size (mm)

20 40 60 80 100 10 100 1000 10000

slide-15
SLIDE 15

Protrusion 2 STA 232

Percent Retained Particle Size (mm)

5 10 15 20 25 30 5.7 - 8.0 8.0 - 11.3 11.3 - 16.0 22.6 - 32.0 32 - 45 45 - 64 64 - 90 90 - 128 128 - 180 180 - 256 256 - 362 362 - 512 512 - 1024

slide-16
SLIDE 16

Protrusion 2 STA 232

Percent Finer Particle Size (mm)

20 40 60 80 100 1 10 100 1000 10000

slide-17
SLIDE 17
slide-18
SLIDE 18
slide-19
SLIDE 19