Shale Gas Monitoring Workshop Mid-Atlantic Volunteer Monitoring - - PowerPoint PPT Presentation
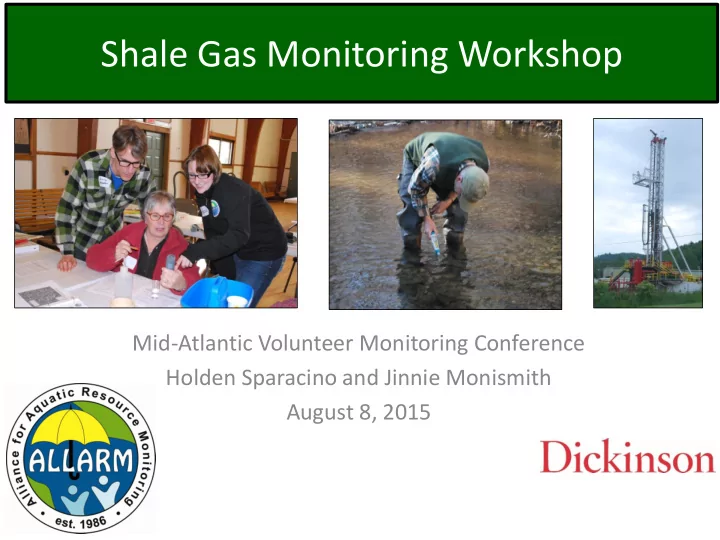
Shale Gas Monitoring Workshop Mid-Atlantic Volunteer Monitoring Conference Holden Sparacino and Jinnie Monismith August 8, 2015 Game Plan Introduction to ALLARM Science of Shale Gas Monitor Protocol Quality Assurance / Quality
Game Plan
- Introduction to ALLARM
- Science of Shale Gas
- Monitor Protocol
- Quality Assurance /
Quality Control
- Findings
- Questions
- Hands-on Meter Testing
About ALLARM
- Director: Julie Vastine
- Assistant Directors: Jinnie Monismith & Holden Sparacino
- Science Advisor/Founder: Candie Wilderman
- 13 Dickinson College Students
- Program of Dickinson College
- 40% supported by the college, 60% funded by federal, state, family
foundation grants
1986 1987 1988 1989 1990 1991 1992 1993 1994 1995 1996 1997 1998 1999 2000 2001 2002 2003 2004 2005 2006 2007 2008 2009 2010 2011 2012 2013
Acid Rain Monitoring Traditional Technical Assistance
Shale Gas
Monitoring Program Region Volunteers Model of C Science Acid Rain Statewide Individuals Contributory WatershedTA Southcentral PA Groups Co-created Shale Gas Marcellus & Utica Groups & Individuals Collaborative
2014 2015
ALLARM History
Empower communities to use scientific tools to monitor, protect, and restore waterways.
ALLARM Areas of Assistance
Scientific
- Study design creation
- Chemical monitoring
- Quality Assurance/ Quality
Control
- Biological Monitoring
- Visual assessment
- Data interpretation and
communication
- Shale-gas monitoring
- Coming soon: Chesapeake Bay
Monitoring
Programmatic
- Strategic planning
- Volunteer recruitment and
retention
Shale Gas Plays
Depth to Marcellus Shale
Depth to Utica Shale
Shale Gas Wells in Region
Unconventional vs. Conventional
http://seekingalpha.com/article/131641-unconventional-natural-gas-just-a-frac-away
Hydraulic Fracturing (Fracking)
This protocol documents flowback pollution and visual
- bservations in small streams.
Differences in Drilling
Traditional Hydrofracking
- Typically 20,000 to 80,000
gallons of fluid were used each time a well was hydrofractured.
- Traditional hydrofracking
used 700 to 2,800 lbs. of chemical additives
- 1940s
High Volume Hydrofracking (HVHF)
- HVHF uses between 2 and 10
million gallons of fluid (on average 5.6 million), the exact amount depends upon the length of the well bore and the number of fractures created along the lateral extent.
- HVHF uses between 205,000 and
935,000 lbs. of chemical additives, per well many of which are toxic to humans and wildlife.
- Late 1990s
www.TCgasmap.org Marcellus Accountability Project-Tompkins
Flowback water
- Quantity: 10-15% of frack water flows back
- Quality:
– Brine (salty water) including high concentrations of chlorides, sodium, sulfates: very high TDS – Metals, e.g. barium iron, manganese, arsenic, strontium, lead, cadmium, chromium, aluminum – Naturally occurring radioactive materials such as uranium, radium, and radon – Bacteria – Methane
- Pathway to environment: spills, incomplete
treatment, well casing leaks, migration through bedrock, illegal dumping
Water that returns to surface - it consists of frack water plus chemicals released from underground rock formations.
What Do Monitors Test For?
- 1. Flowback Monitoring:
Chemical Parameters Indicator chemicals
Conductivity & TDS Signature Chemicals Barium Strontium
Stage Monitoring
Relationship to conductivity
- 2. Physical Impacts
Visual Observations:
- Land disturbances
- Spills and discharges
- Gas migration/leakages
- Pipeline impacts
Goal: Red flag monitoring
- Document violations
- Report to agencies
to respond
- Frack water mixes
with natural brine, found in the shale
- Flowback water
contains high concentrations of salts and metals
Picture by Amy Bergdale, US EPA
Why Conductivity and TDS?
Barium and Strontium
- Naturally-
- ccurring
metals found deep underground
- Indicate
contamination from Marcellus Shale activities (signature chemicals)
https://www.msu.edu/~zeluffjo/periodic_table.gif
Stage Monitoring
Visual Assessment
- Earth Disturbances
- Spills and Discharges
- Gas Migration/Leakages
- Pipelines
Marcellus Shale Well Sites in Dimock, PA; 2010
Photo courtesy of PA Council of Trout Unlimited Photo courtesy of PA Council of Trout Unlimited
Earth Disturbances
http://www.postcarbon.org/reports/shale-gas-well.jpg
Drilling fluid spill at Cabot site Dimock, PA September 2009
Photo courtesy of Delaware Riverkeeper Network Photo courtesy of Delaware Riverkeeper Network Photo courtesy of Delaware Riverkeeper Network Photo courtesy of Delaware Riverkeeper Network
Spills and Discharges
Gas Migration or Leakages
ALLARM ALLARM
ALLARM
Pipeline Erosion & Sedimentation
ALLARM ALLARM
Online Monitoring Toolkit
http://blogs.dickinson.edu/marcellusmonitoring/
Meter Trials
Dickinson students, faculty, and staff helped test conductivity/TDS meters to determine which meter is most accurate, precise, and easy to use.
Tailoring the ALLARM Protocol
Establish where wells are located and where they will be located. Find an entity who is willing to perform QA/QC checks (conductivity & TDS) and barium & strontium analysis (signature chemicals). Determine which agency you to report violations (multiple) & understand how they will respond.
Well Location Information Laboratory Testing Agency Reporting
Well Location Information
- State agency
- Non-profit entity
Develop a protocol for monitors to find/track well locations and status.
Laboratory Testing
- State agencies
- State-certified labs
- Colleges/universities
Develop an agreement and create a protocol for monitors to follow.
Agency Reporting
- Local, state & federal
agencies
- Interested parties
Develop a decision tree and a contact list for monitors to use if they witness a violation.
Data Use: Decision Trees
Report monitoring information when values exceed criteria in decision trees Chemical Monitoring * Visual Assessment * Pipelines
ALLARM’s QA/QC Program has led to:
- 1. Agreement with PA DEP to prioritize calls from volunteers with
information about a suspected pollution event
- 2. EPA approved Quality Assurance Project Plan (QAPP)
Quality Assurance/Quality Control
- Training provided:
- Care for equipment
- Calibrate equipment
- Collect and test a water sample
- Documented procedures
- Replicates
- Split sample analysis (twice/year)
- Monitors send samples to
ALLARM twice a year.
- Samples are analyzed by
ALLARM for conductivity and total dissolved solids.
- Monitor’s results are
compared to ALLARM’s results for precision.
Split Sample Analysis
ALLARM Data Analysis
Data collected 2010 – 2013 Dataset was reduced
- Monitoring frequency
- QA/QC
Conductivity values compared to watershed characteristics
- Watershed size
- Geology
- Land cover
- Number/density of wells
in watershed
Watershed Size
Most of the monitoring sites were in small, headwater streams.
- 58% of the watersheds were less than 10 square miles.
- 88% of the watersheds had a drainage area of less than 50 square miles.
Watershed size did not influence conductivity values.
Geology
For the purpose of the analysis, the geology was categorized as: There was a strong relationship between conductivity and the percent limestone in the watershed.
Land Cover
Most of the watersheds were predominately in forested areas (101 of 116). Sites with the highest average conductivity values (1245 – 1647 µS/cm) were generally found in developed areas. The eight urban sites also had a large amount of limestone in the watershed.
Drilled Wells
Only 23 (of 116) sites were downstream from a shale gas well. The number of wells drilled in each watershed ranged from 1 – 475, although only two watersheds had more than 12 shale gas wells. Conductivity was not influenced by the number
- f wells or the density of
wells in the watershed.
Conclusions
Average conductivity values in streams were related to the amount of land development (urban area) and limestone (geology) in the watershed. It is not significantly related to the size
- f the watershed or the
number/density of drilled wells (although only 23/116 watersheds had wells drilled at the time of sampling). The ALLARM Shale Gas Volunteer Monitoring Program has demonstrated the value of a large volunteer-collected dataset in detecting patterns related to watershed characteristics. The dataset shows similar patterns to data reported in the scientific literature.
Questions?
Alliance for Aquatic Resource Monitoring (ALLARM) Phone: 717.245.1565 Email: allarm@dickinson.edu Website: dickinson.edu/allarm Toolkit: blogs.dickinson.edu/marcellusmonitoring/ Social Media: @allarmwater facebook.com/allarmwater
Hands-on Activity
Monitor Equipment: 1. LaMotte Tracer PockeTester and calibration solution vial 2. 84 µS/cm & 1413 µS/cm standard calibration solution 3. Distilled water wash bottle 4. Stream testing bottle 5. 3 sample bottles
– Two sample bottles for QA/QC – One bottle for pollution event Ba and Sr analysis
6. Gage Stick