
SLIDE 1
8/30/16 1
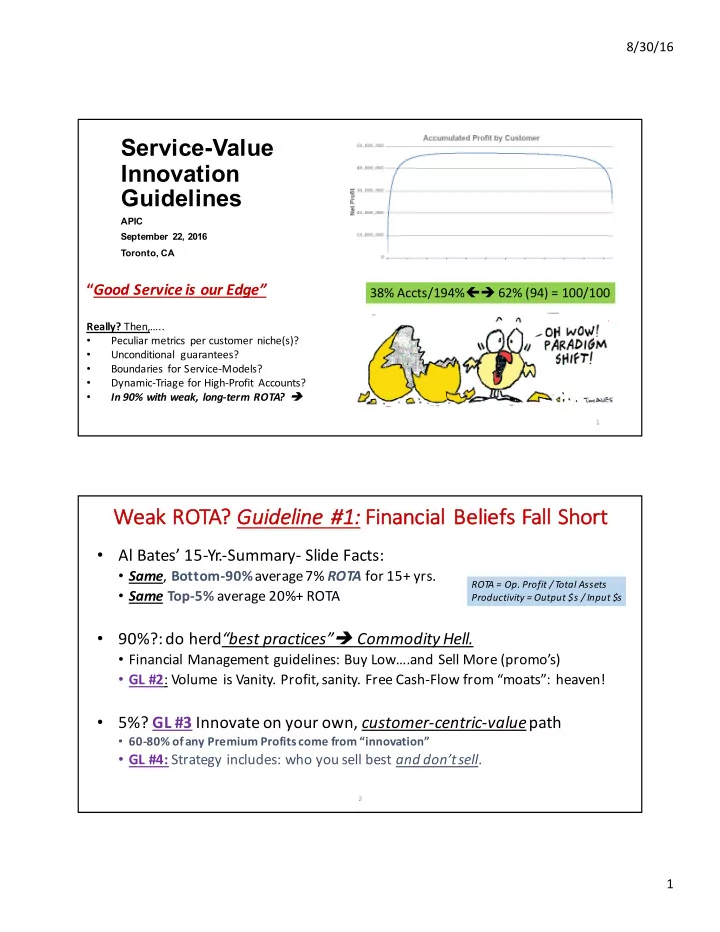
Service-Value Innovation Guidelines
APIC September 22, 2016 Toronto, CA
1
“Good Service is our Edge”
Really? Then,…..
- Peculiar metrics per customer niche(s)?
- Unconditional guarantees?
- Boundaries for Service-Models?
- Dynamic-Triage for High-Profit Accounts?
- In 90% with weak, long-term ROTA? è
38% Accts/194%çè 62% (94) = 100/100
We Weak ROTA? Gu Guideline #1: Fi Financial Beliefs Fall Short
- Al Bates’ 15-Yr.-Summary- Slide Facts:
- Same, Bottom-90%average 7% ROTA for 15+ yrs.
- Same Top-5% average 20%+ ROTA
- 90%?: do herd“best practices”è Commodity Hell.
- Financial Management guidelines: Buy Low….and Sell More (promo’s)
- GL #2: Volume is Vanity. Profit, sanity. Free Cash-Flow from “moats”: heaven!
- 5%? GL #3 Innovate on your own, customer-centric-valuepath
- 60-80% of any Premium Profits come from “innovation”
- GL #4: Strategy includes: who you sell best and don’t sell.
2
ROT A = Op. Profit / T
- tal Assets
Productivity = Output $s / Input $s